



LOWFI/0 is the original Latent Outlook Weekly Forecasting Interval model. It estimates one number per team and knows nothing else: not the score, not the opponent’s quality, not the margin, not even if a team has been winning or losing.
This page describes how it works. For why it exists, see the introduction.
Definitions
True strength (p): a team’s long-run probability of beating an average opponent on a neutral field. Conceptually, the winning percentage the team would settle at over an unbounded number of games.
p is never observed. LOWFI/0 estimates it via a Beta distribution. Beta is the conjugate prior for a binomial process and is supported on [0,1]; usefully, the sum of its two shape parameters (α + β) is interpretable directly as a number of games of evidence and as a point estimate (α/(α + β) = expected true strength).
Preseason prior
LOWFI/0 is intentionally low-fidelity, so it has no external information to seed itself with - no market prior, no roster data - so it uses last season’s results in two ways:
Carryover: Each team’s season win rate is regressed on its own previous season across all available seasons. The fitted slope is 0.340 - this implies that a 12-win team should be expected to roughly win 9.5 games the following season, without any other information.
Prior width: Observed variance in season win rate is the sum of true talent variance and binomial sampling variance. The sampling component, p(1−p)/n, is subtracted before solving for the Beta parameters by method of moments:
σ²_talent = σ²_observed − E[p(1−p)/n]
This yields a true talent standard deviation of 0.1472, implying a prior concentration of 10.5 pseudo-games. Omitting the correction produces a prior roughly twice as wide, having treated seventeen games of sampling noise as ability.
These two metrics generate the preseason distribution around estimated true strength.
Game probabilities
For teams A and B with strengths p_A and p_B, the head-to-head probability is the log5 formula:
P(A beats B) = (p_A − p_A·p_B) / (p_A + p_B − 2·p_A·p_B)
Important properties of log5: returns p_A when p_B = 0.5; symmetric; multiplicative in odds space, so equal rating gaps at the extremes imply larger probability gaps than equal gaps near the mean.
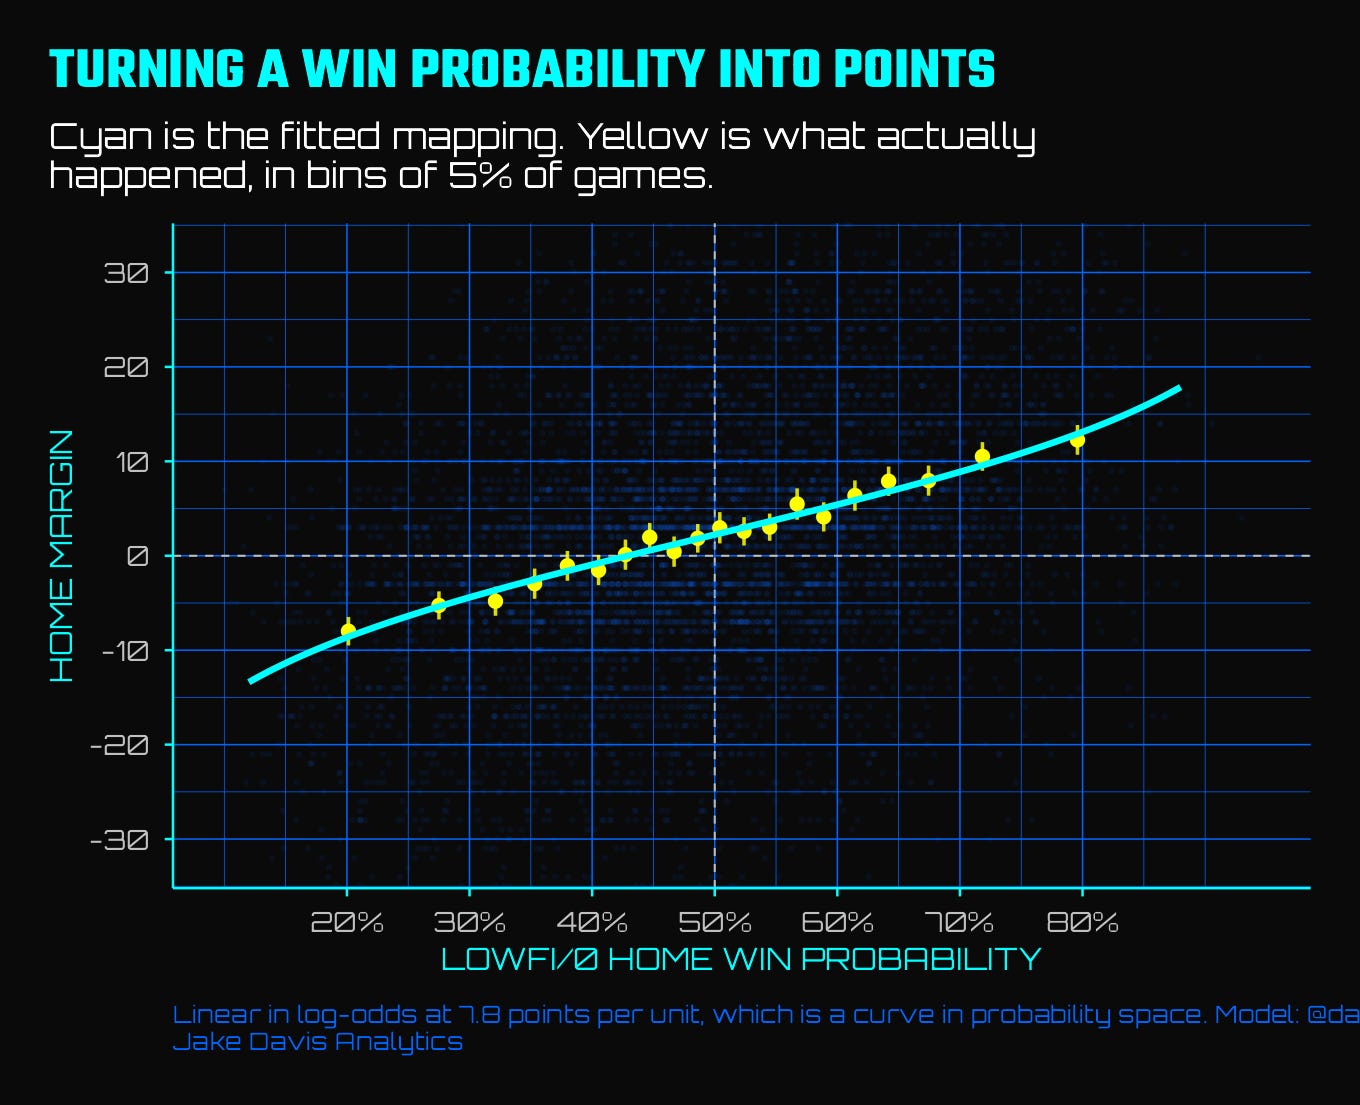
Home field is applied separately and is fitted from a rolling history of home margin. Current estimate is 2.26 points, having moved across eras: 2.53 (2004–2015), 1.78 (2016–2019), 0.91 (2020–2021), 2.15 (2022–present). This estimate is applied in the margin mapping detailed below
In-season updating
The default update rule is rejection sampling (approximate Bayesian computation). Each week, per team:
Draw n = 4,000 candidate strengths from the team’s current estimated Beta distribution.
Draw the opponent’s strengths from theirs.
Compute log5 win probability for each paired draw; sample a Bernoulli outcome from that derived probability.
Retain only the strength draws whose simulated outcome matches the actual result.
Refit a Beta distribution to the retained draws by method of moments.
Margin mapping
LOWFI/0 does not model expected margin of victory. For simulation purposes and for comparison against a spread, its win probability is mapped to an expected margin by OLS regression of observed home margin on the log5 logit, fitted on training seasons only. This is a calibration mapping, not a forecast of points, and LOWFI/0 is excluded from margin-accuracy evaluation for that reason.
Season simulation
10,000 simulations per run via nflseedR, which implements NFL seeding and tiebreaker rules including divisional and conference records, common games, strength of victory and strength of schedule.
Each simulation draws one strength per team and holds it for the full season. Redrawing weekly would average the uncertainty about team quality within each simulated season and produce win-total distributions that are too narrow.
Projected wins, division odds, playoff odds and draft position are then calculated by counting up how many times different outcomes occur.
Held-out performance
Fitted through 2022, evaluated on 2023–2025 (816 games, unseen):
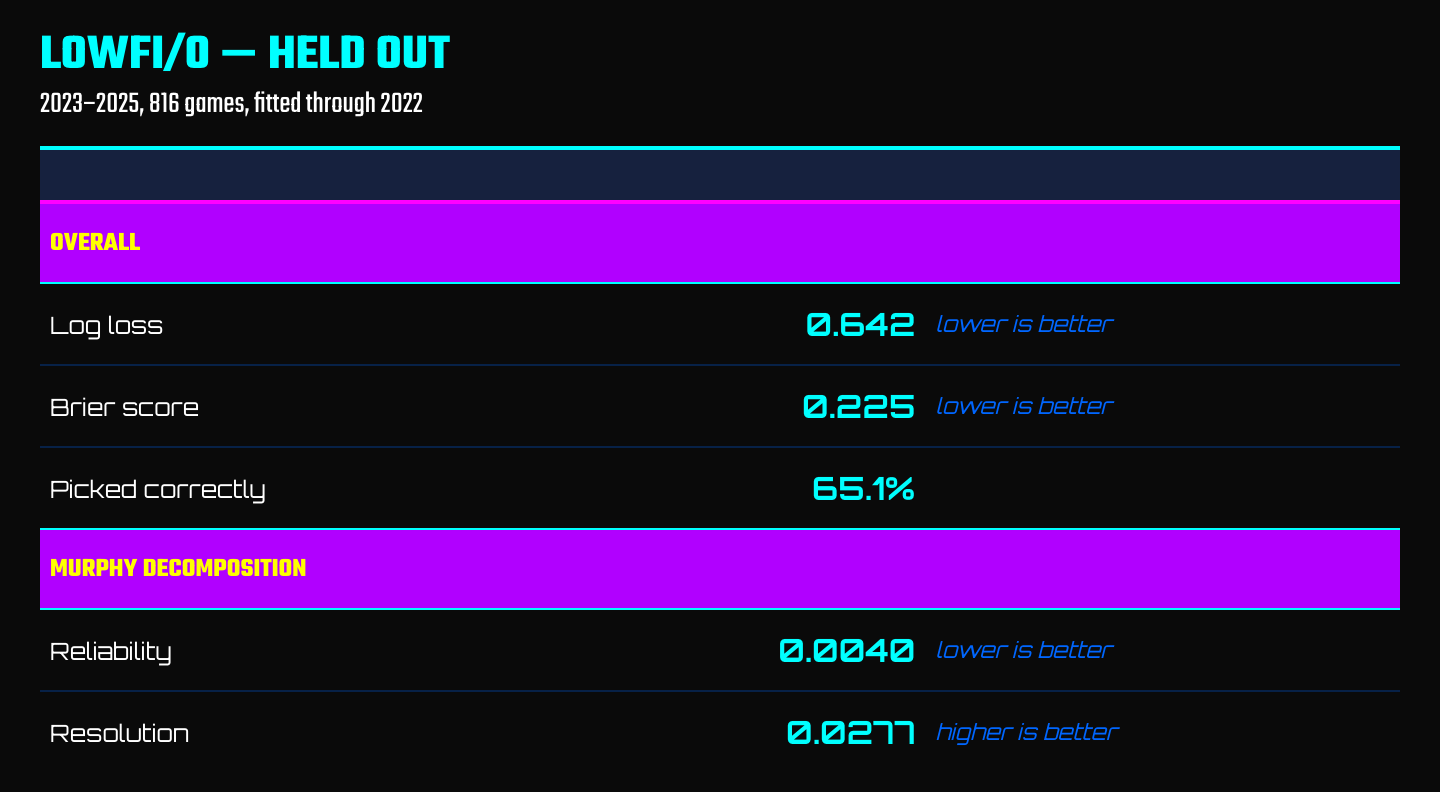
Log loss reference points on the same games: closing line 0.610, LOWFI/1 0.632, point-differential SRS 0.680, home field only 0.690. A constant 50% forecast scores 0.693.
By phase of season: weeks 1–6, 0.671; weeks 7–13, 0.616; weeks 14–18, 0.640.
Known limitations
No strength of schedule. Opponent quality is not an input. Early-season ratings are therefore biased in a predictable direction while schedules are unbalanced.
No margins. A one-point win and a thirty-point win are the same observation.
Week 18. Log loss deteriorates to 0.718 in week 18 against the market’s 0.586. Seeding-driven rest is unobservable to a results-only model.
Beta refit is a bit of a hack. The true ABC posterior after several weeks is not exactly Beta; forcing it back to one each week discards some shape. Not currently quantified.