



See the detailed methodologies for LOWFI/0 and LOWFI/1
Back in 2018 or so, I was really getting into statistical programming with R, partly for work (I hated writing SQL), and mostly because the nflscrapR package went live. This beautiful little API gave analysts unprecedented access to NFL data, and public analytics space would never be the same. I wanted to get in on the action, and so I started exploring the data, joining in with a growing community of like-minded nerds in building analyses and visualizations and occasionally finding interesting insights.
But as the analyses and models proliferated (often with a bent on betting), I became obsessed with an idea - how well could I project an NFL season…with very little information? Like, what if I never told the model if a team was winning or losing?
And so, I set out to test this idea - first building a relatively simple model before tinkering a tweaking it to become more advanced, but always keeping that constraint in mind - the model(s) would never know if a team was winning or losing during the season.
I have been building some version of this model for about eight years. And while I’ve published bits and pieces about it on the internet (mostly on the current hellscape formerly known as Twitter), this is the first time I am fully publishing it. With a name and everything!
And so today I present to the internet a new NFL projection system - LOWFI!
LOWFI stands for Latent Outlook Weekly Forecasting Interval, and is an NFL rating and projection system that runs on data that can be found in box scores - points scored, points against, who’s playing whom, and preseason betting win totals. That’s it - no play-by-play data, no personnel, no injury reports, no passing information, no wins or losses.
The constraint is the point, and I will get to why. But first, how LOWFI came to be.
Where it came from
The first version was built in 2018, and it barely knew anything. I wanted to see how accurately I could project a season if the model is never actually told the score.
So I gave every team a distribution of “true” strength1, drew thousands of possible values from those distributions, “played” the season out with those draws, and then - this is the part I still like - threw away every simulation where the wrong team won. The model was never told anyone had won a game. It just stopped carrying the versions of the world where they hadn’t. What was left over became the basis for the new distribution.2
It worked better than I ever expected. The model would pick up on trends like injuries and poor play without ever observing them, and did a pretty good job of getting to final win-totals pretty early in the season.
Over time, I wanted to add some concepts to the model - specifically, the original model only produced win probabilities in individual games, and I wanted to produce margin of victory predictions. So the next major version added points. That’s roughly what LOWFI is today, though almost every line of it has been rewritten a few times, with better exploration, visualization, and evaluation techniques, and now the system is fully automated. Both versions of the models exist, and they have now been christened LOWFI/0 (the (mostly) original strength model, and LOWFI/1 (the more advanced model that uses points and projects offensive and defensive strengths)
Why keep the constraint?
For two reasons.
The first one: nobody publishes what the extra information is worth. Nearly every published model uses more data than the last one, and every model reports that it is good. Almost none of them report what happens if you take major inputs away. I wanted a system where that comparison is inherent in the system - so LOWFI/0 knows only universes that agree with reality (though it doesn’t know what reality happened, at least explicitly), LOWFI/1 adds points, and both run every week, side by side, scored against the same games.
The second one: because I wanted to! The whole genesis of this side project was to see how well I could do with limited information, and that remains the goal. I have an idea of a more advanced, play-by-play derived system3, but I haven’t found the time to fully build it yet. Maybe next year!
What LOWFI actually is
Two models, run in parallel every week.
LOWFI/0 knows almost nothing. Each team is represented as a single probability (i.e. true strength) of beating an average opponent, carried as a distribution rather than a number, updated by discarding the simulations that disagree with reality.
LOWFI/1 knows points scored and points allowed and adjusts them for opponent4. Each team gets an offensive rating and a defensive rating, both in points per game against average.
Both then simulate the rest of the season ten thousand times, through the NFL’s actual seeding and tiebreaker rules5, which is where projected wins and playoff odds come from.
The system is called Latent Outlook Weekly Forecasting Interval because the things it estimates - true strength, offensive and defensive rating - are inferred rather than observed, re-estimated every week, and published as an interval. It is also low fidelity, at least relative to models like DVOA or FPI, though that doesn’t mean it’s bad.
How good is it?
The models are fitted on every completed season through 2025. To test them, I fitted a separate version that stopped at 2022 and scored it on 2023 through 2025 - 816 games it had never seen. Those are the numbers below:
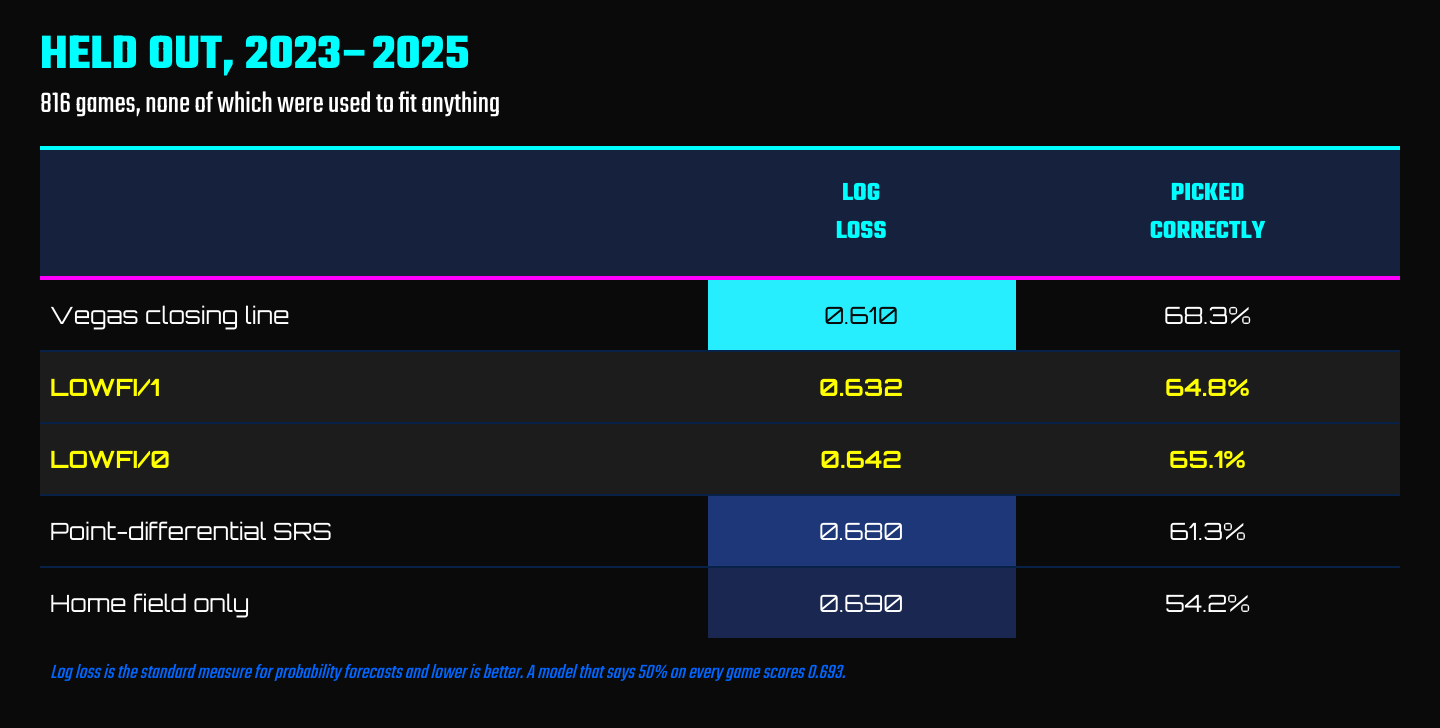
Log loss is a standard measure for probability forecasts and lower is better; a model that says 50% on everything scores 0.693.
LOWFI/1 does not beat the market (and is not designed to). It finishes 0.022 behind the closing line and correlates with it at 0.85. I will publish the comparison anyway, because it is the only external benchmark that matters, and because a model that avoids being scored against the market is telling on itself.
The gap to Vegas is not calibration. Breaking the score into its components, LOWFI/1’s reliability - whether a stated 40% win probability happens 40% of the time - is actually better calibrated than the closing line. What the market has is resolution: it commits harder (LOWFI/1 might say 60% chance to win, the market implied 72%, etc). Whatever it knows that this model doesn’t shows up as confidence, not necessarily as correctness.
Surprisingly, LOWFI/0 is right there. Just a nat’s hair behind6, and slightly ahead on raw accuracy. The gap is real - I tested it statistically - but it is small, and it lives in calibration rather than in picking winners.
What to expect out of LOWFI
I’ve automated LOWFI to run every Tuesday morning. My goal will be two posts per week derived from that run.
The first is about the league and that week’s games. Updated ratings with their uncertainty, projections and playoff odds by division, this week’s games with the model’s line beside the market’s, and how far each team’s week moved their season. This is where you will come to see what the model thinks about the next week and the rest of the season.
The second will be thirty-two team cards, one per team, starting after Week 1. The cards will profile each team - current record and scoring, four different reads on how good a team is (their current record, their Pythagorean expectation, LOWFI/0 and LOWFI/1, all converted to a projected 17-game record), and a breakdown of how LOWFI/1 derives the offensive and defensive ratings.
Both come from one system, and every number is written to disk before a single chart is generated. Betting lines are snapshotted before kickoff, every week, whether the model has an opinion or not. If I ever claim to have beaten a number, the number will be on file from before the game.
Where LOWFI is right now
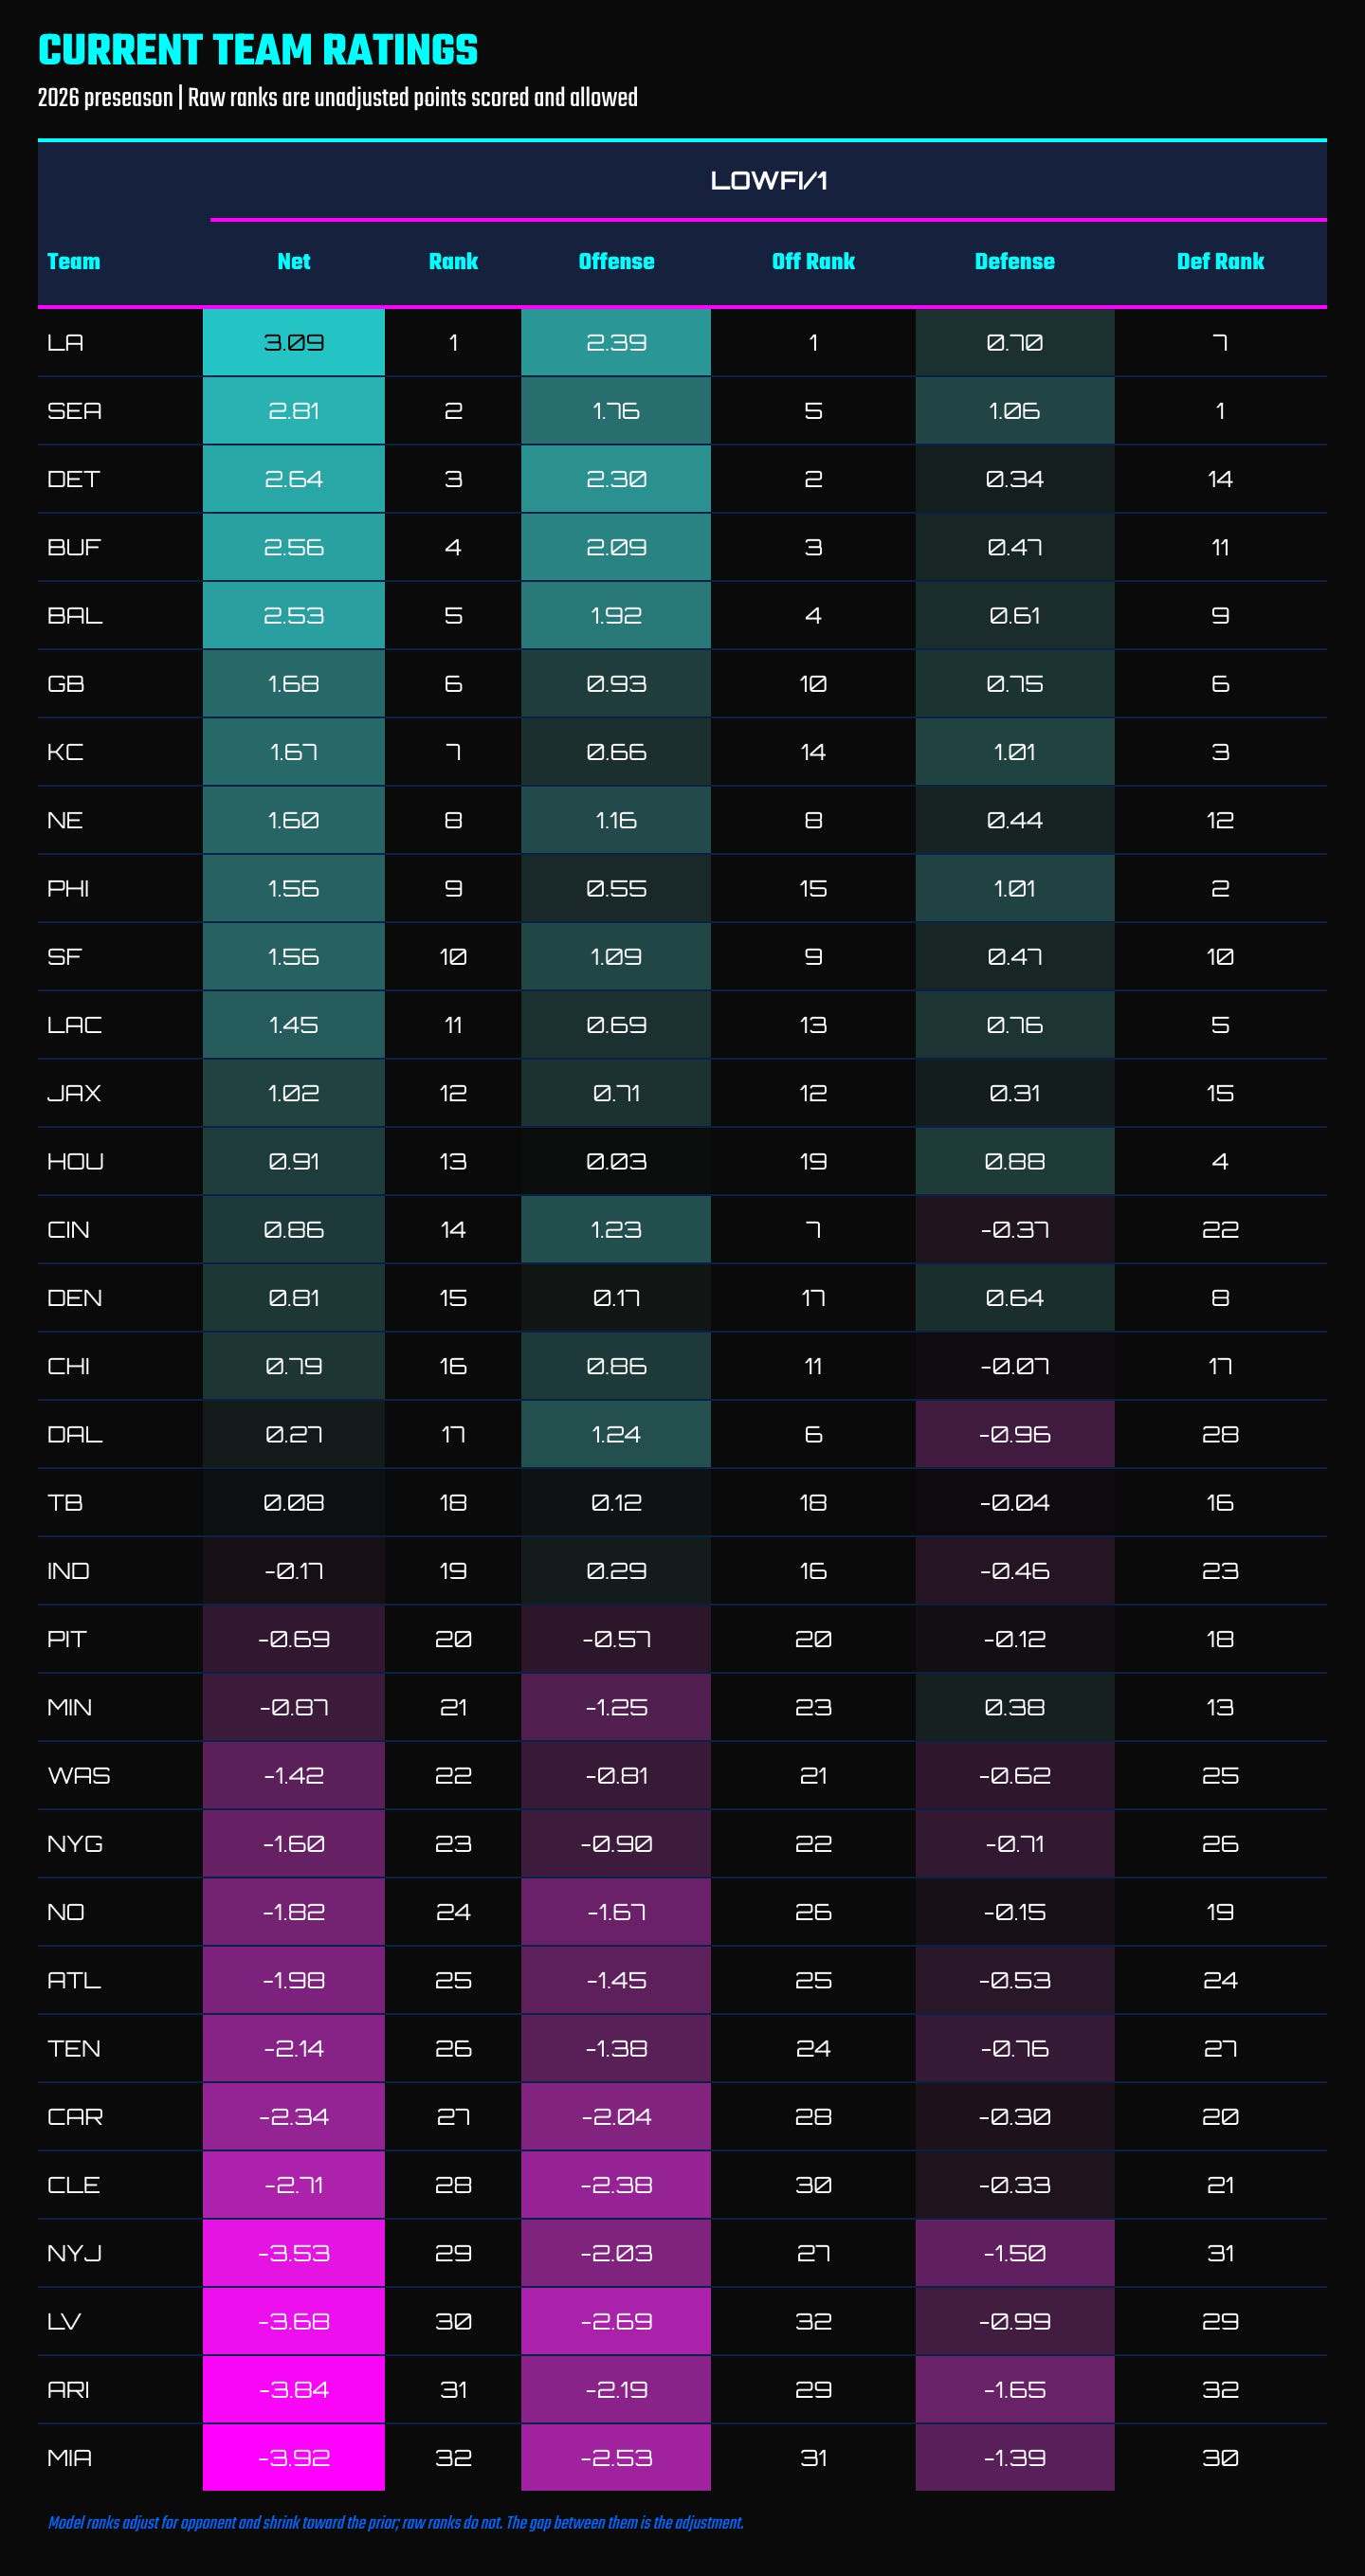
Preseason 2026, which means these ratings are the market’s opinion split into offense and defense using last season’s finish, and not much else. Twenty-seven percent of the variance in where teams actually end up, give or take.
The Rams, Seahawks and Lions open at the top. Miami, Las Vegas and Arizona open at the bottom. Top to bottom the whole league spans about seven points a game, and every single interval overlaps with most of the others. That is not the model hedging. Seventeen games is a very small sample, and in September nobody knows anything.
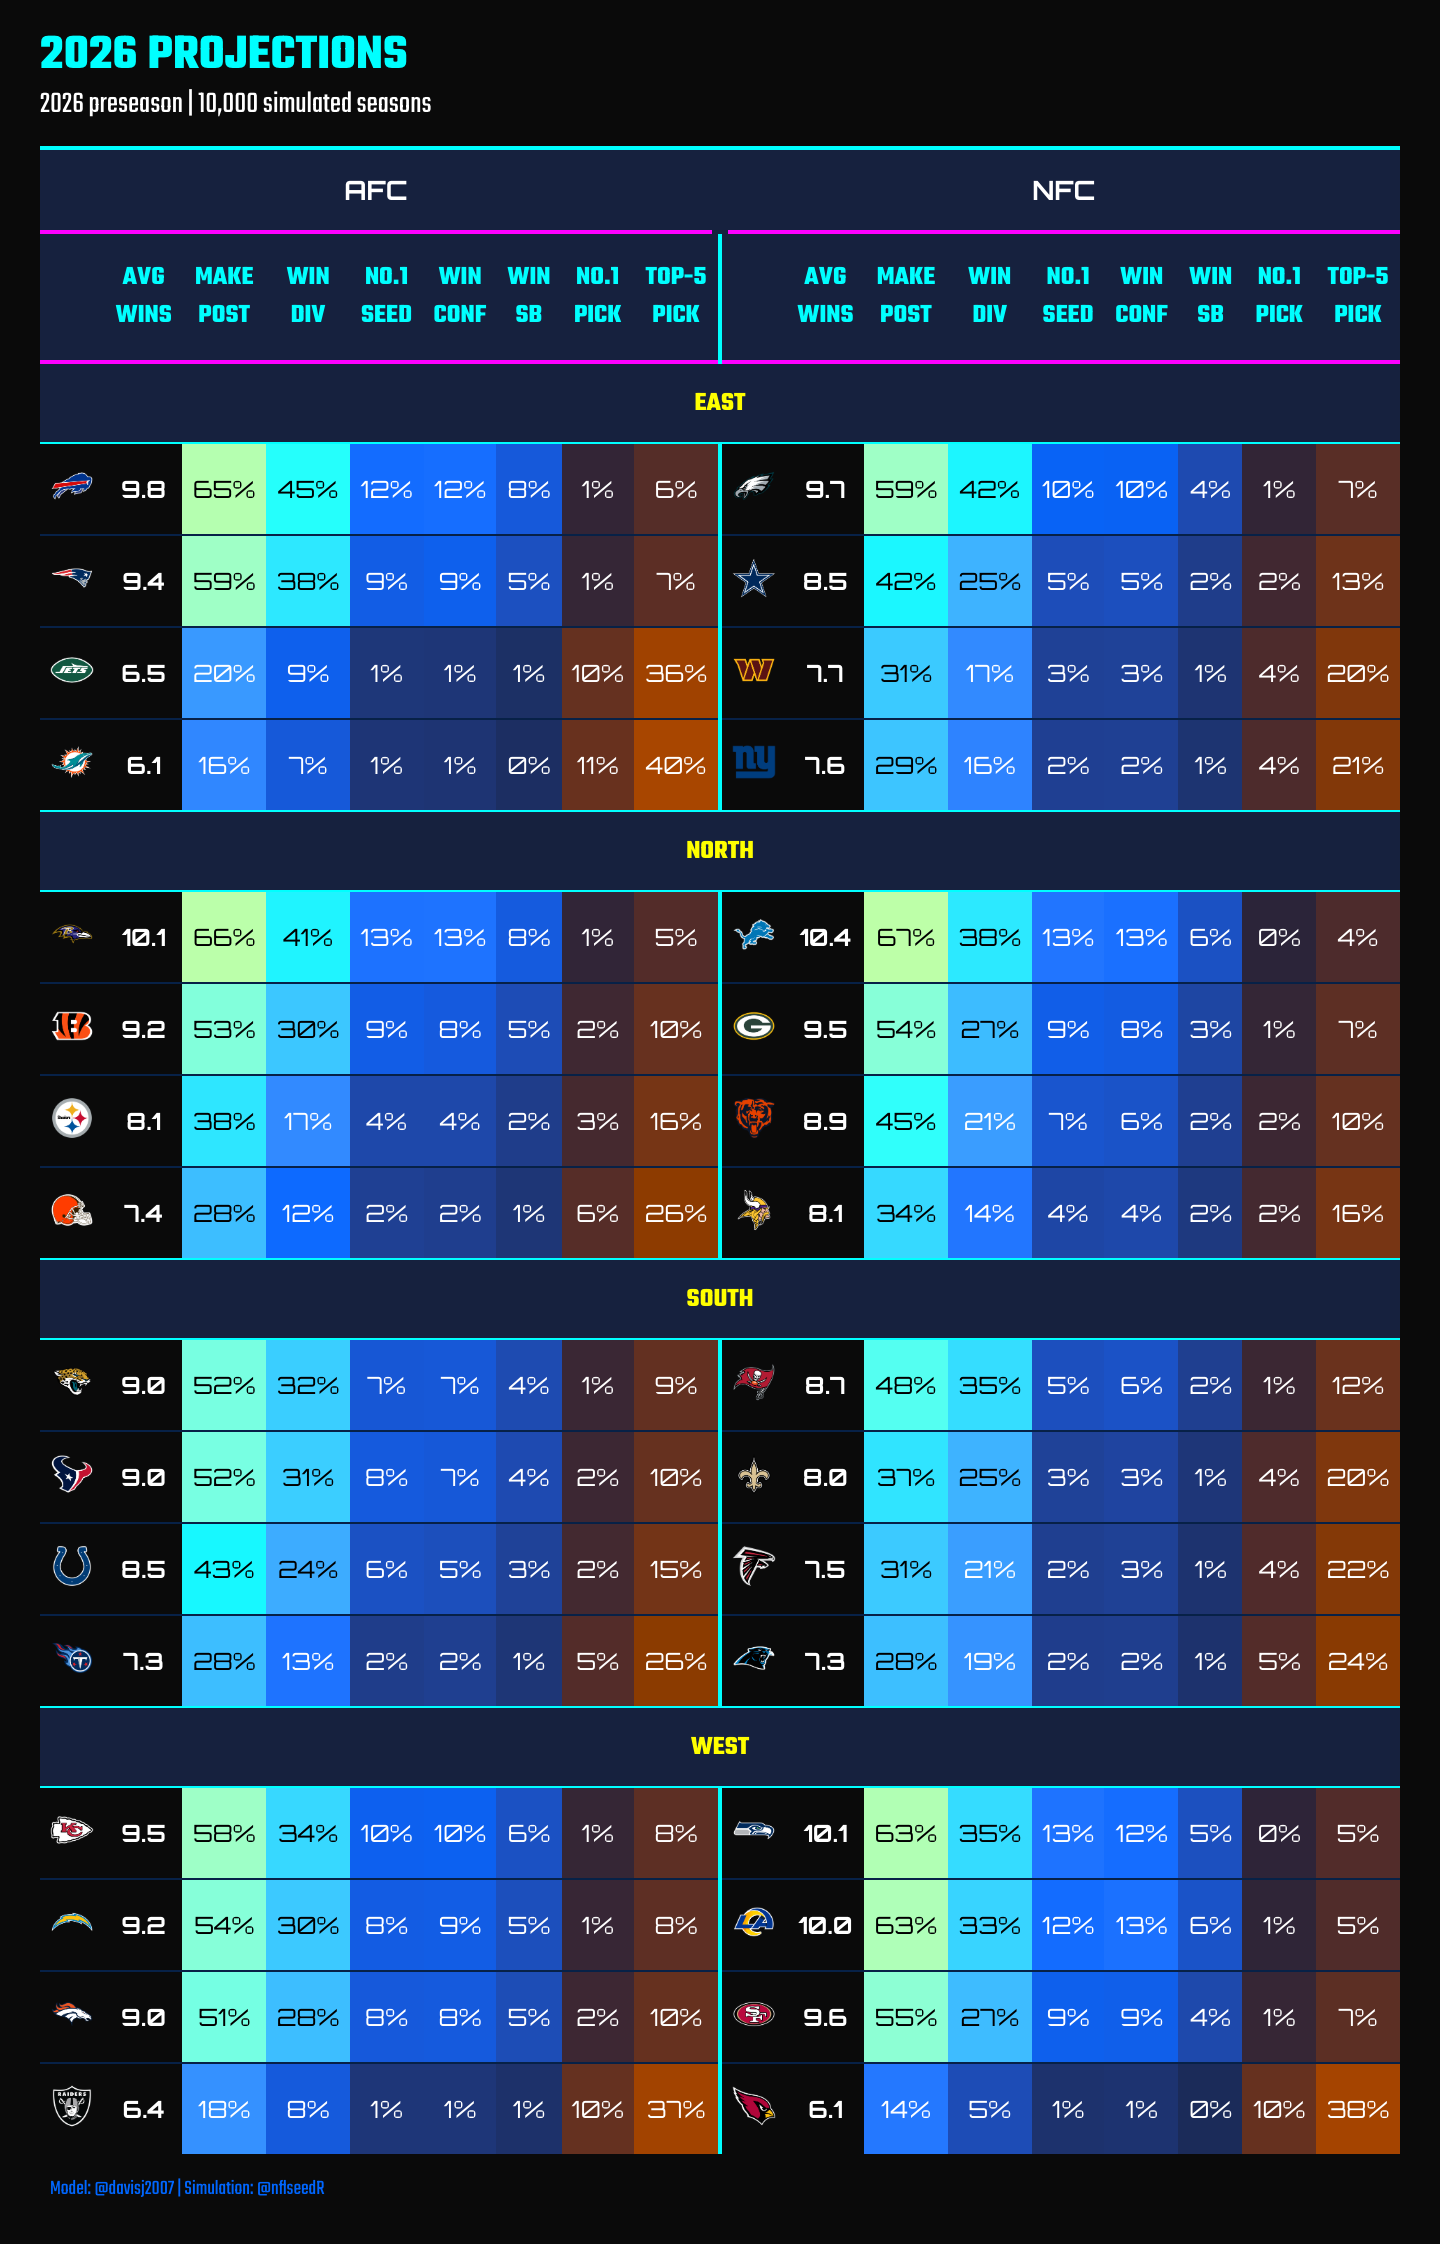
Baltimore actually opens with the best Super Bowl odds, though they won in less than 8% of simulations. Miami opens with the best odds at getting next season’s number one pick, with just about 11% of simulations ending with them in last place.
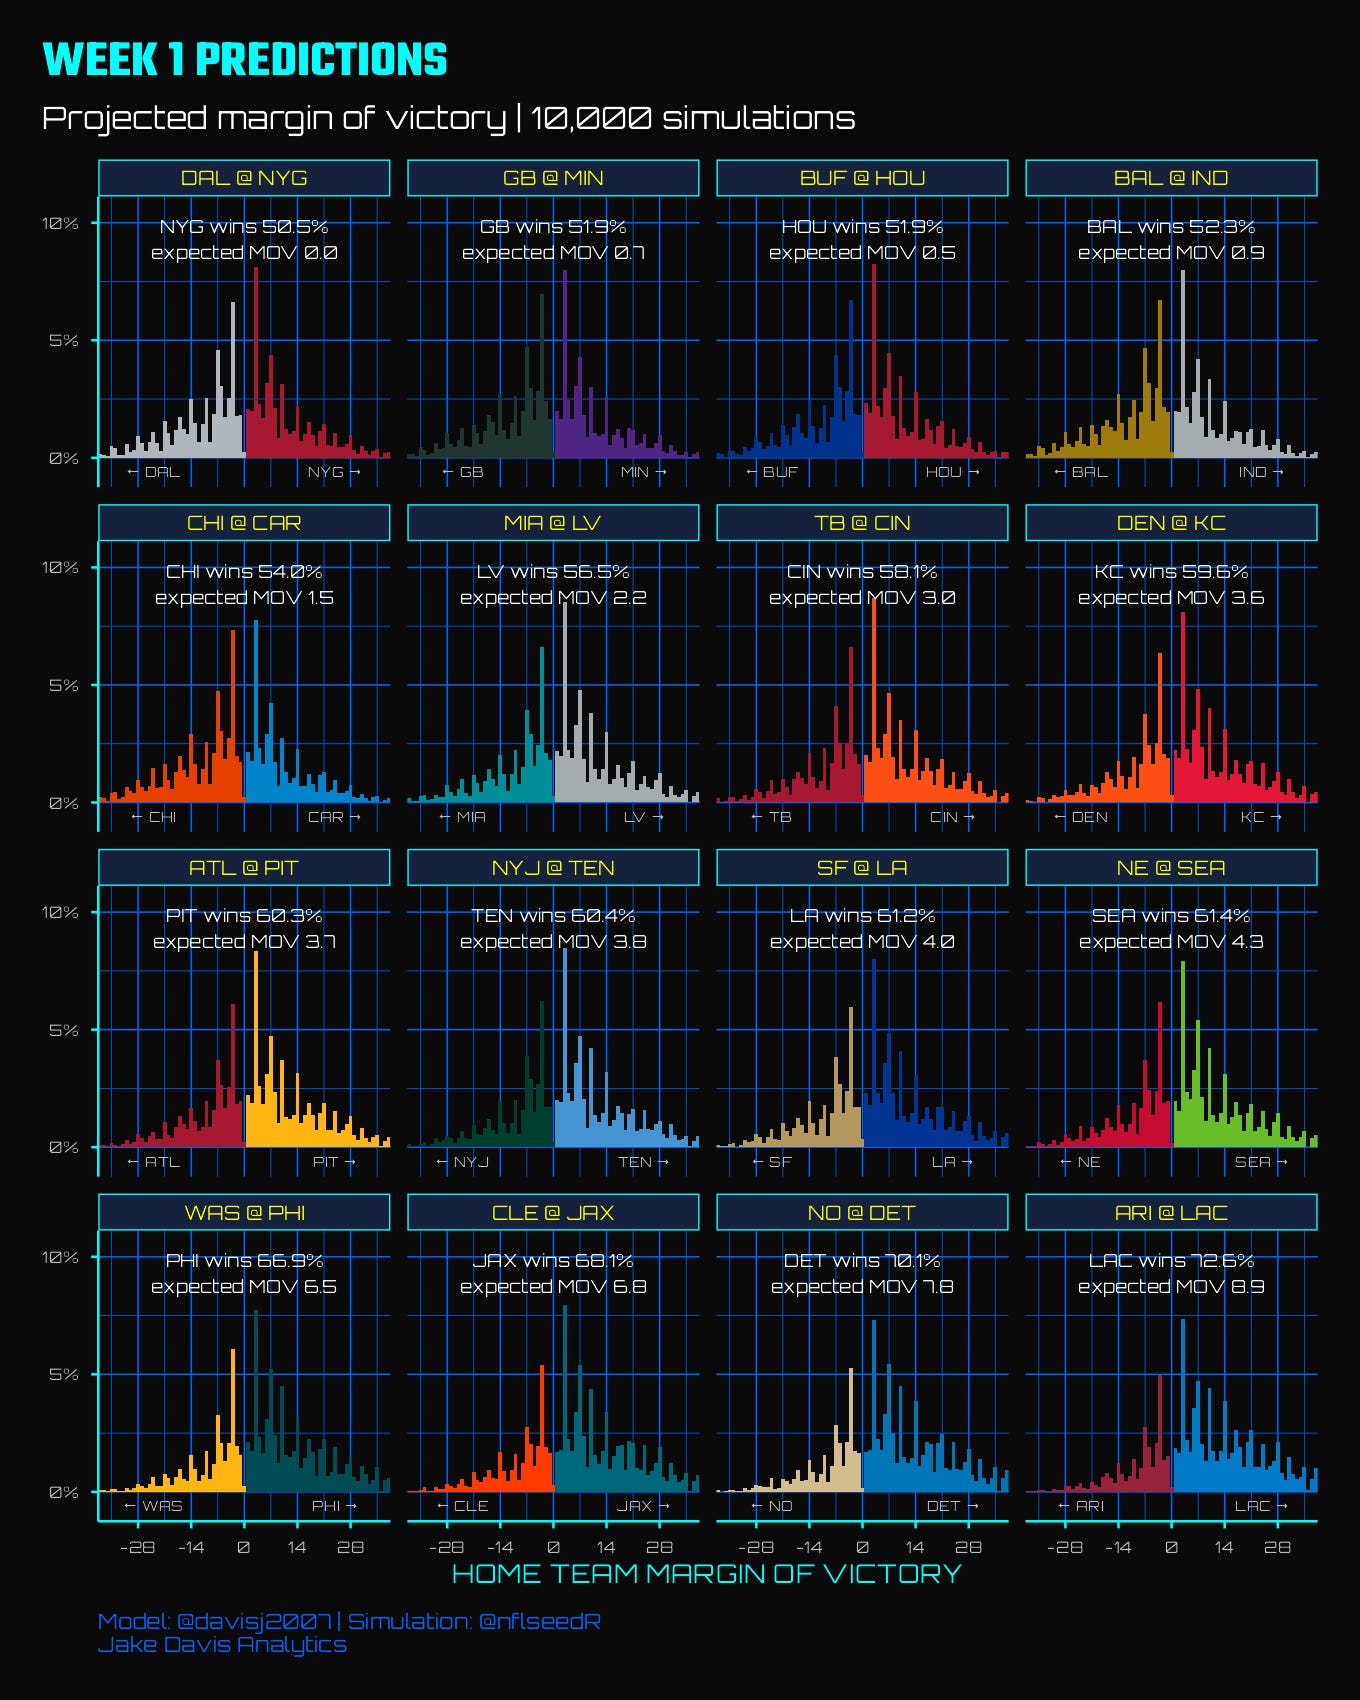
LOWFI/1 (and LOWFI/0, too, though I don’t plan on publishing all that detail every week!) also produces per game forecasts, with margin of victory distributions. Check out week 1.
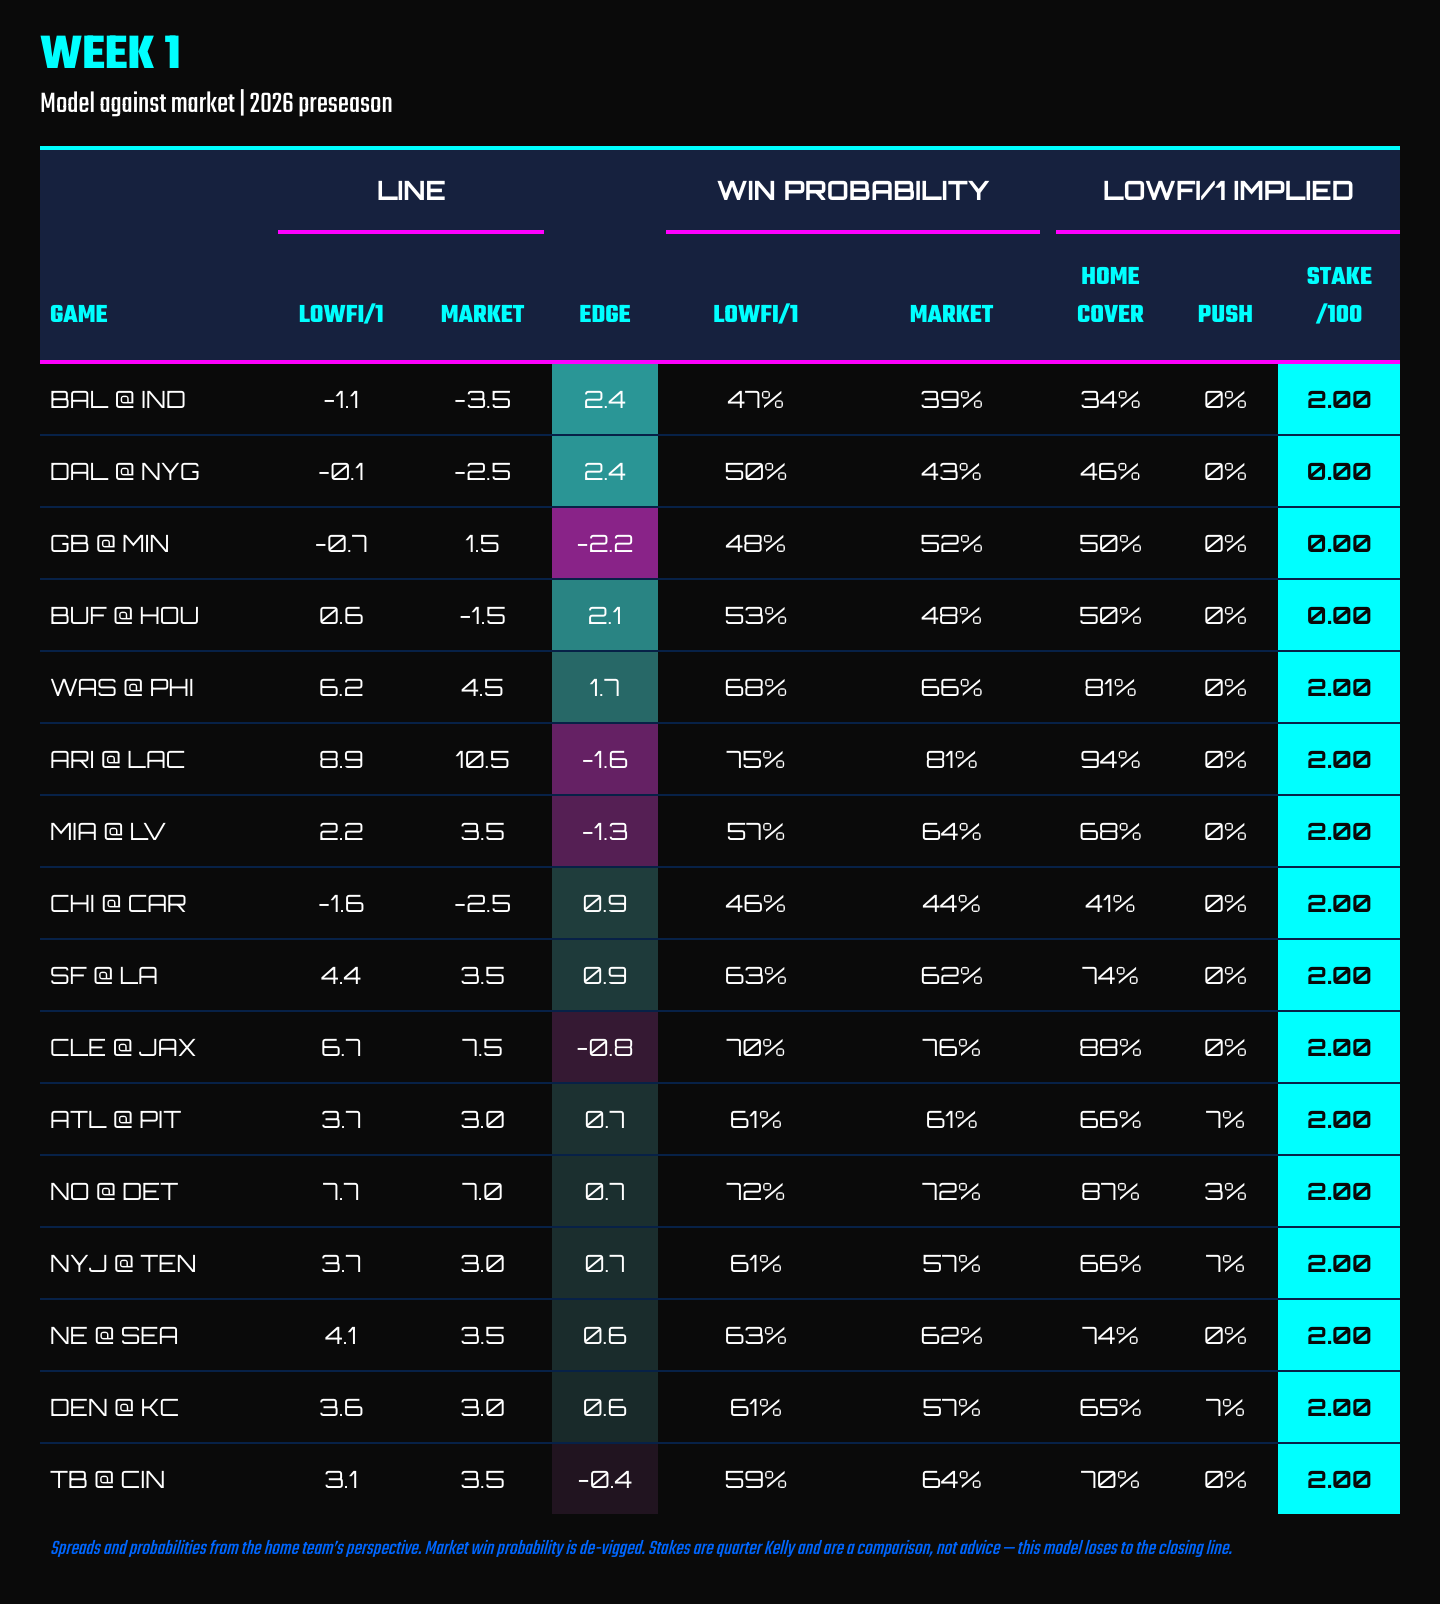
LOWFI isn’t perfect
A projection system built on somewhat limited data is gonna have some flaws. Here are some of the major ones out of LOWFI.
Week 18 is bad. Once seeding is settled, good teams might rest starters. The market knows who is sitting. A model built on final scores has no idea, and week 18 is by a wide margin its worst week of the season.
Preseason projections are too tightly bunched, by about 20%. Teams sit closer to 8.5 wins than they should. It costs roughly a percent of accuracy and mostly affects how things look.
The preseason rating is the market’s opinion, not an independent one. At week 1, LOWFI/1 is largely restating a betting line. It stops being true fairly quickly, but it is true in September.
Defense is measured worse than offense, in every week of every season. Offensive identity carries about 2.2 times the separable signal. That is a property of football rather than a fixable flaw, and it is why every defensive rating here comes with a wider band.
Personnel is unknown, and the model only picks up on injuries, suspensions, and benching based on changes in the underlying performance of the team, rather than by knowing a QB has gone down (in backtesting, the 2025 Colts remained “good” in the model for a few weeks after Daniel Jones got injured, despite being terrible to watch).
What I’ll be watching
I know how this model performs on 2023 through 2025, because I held those seasons out and never touched them. I do not know how it performs on 2026, and neither does anyone else!
What I want to find out, in public, with the numbers filed in advance:
Does knowing the score keep mattering, or does the gap close? Does LOWFI/0 stay within a hundredth? Does the compression I can measure in the preseason actually cost anything by November? Ask me in February.
-Jake
I conceptualized “true” strength as the long-run winning percentage a team would settle on if it played an “infinite” number of games.
This has a proper name - rejection sampling, or approximate Bayesian computation - though I did not know it at the time. I had implemented a technique I didn’t formally understand or know about, and got lucky that it worked!
Call it, um, HIFI - acronym coming soon!
Amongst some other fancy things - read the methodology page for details
Nats - natural units of information, base e. It’s a real thing! I have been sitting on that one for a while and I am not sorry.