


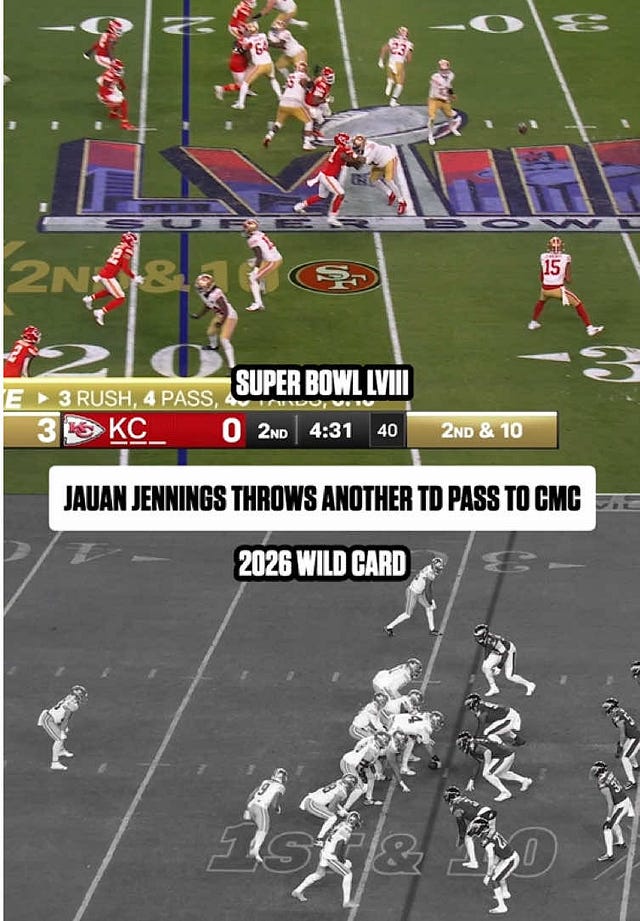
A few weeks ago, during the NFL Wildcard matchup between the San Franscisco 49ers and the Philadelphia Eagles, Jauan Jennings threw a beautiful touchdown pass to Christian McCaffrey down the right sideline - Jennings hit him in stride while sprinting to his right, lofting a fantastic ball for the easy touchdown.
The only weird thing about the pass? Jennings isn’t a quarterback. He’s a wide receiver! And it’s not the first time he made a great throw in a high leverage situation - he hit McCaffrey for a touchdown in the freakin’ Super Bowl (a game in which he also caught a TD). That throw wasn’t quite so impressive, physically, but he looked off defenders, waited, and then delivered a strike on a perfectly set up cross-field screen.
 Tiktok failed to load.
Enable 3rd party cookies or use another browser
Watching Jennings’ throw made me think of Antwaan Randle-El’s 43 yard Super Bowl XL TD pass to Hines Ward (big yinzer over here #HereWeGo).
Which of course led me to the only logical end place - who is the greatest non-QB passer of all time?
When a non-QB tosses the pigskin, three things can happen, and two of them are bad. So using this as a baseline, I refined my question to something far simpler (and probably dumber, at least in terms of actual football value). What non-QB was the best at completing passes? And that rabbit hole of course took me to the inevitable question - who is the greatest completer of passes in NFL history?
“Jake, of Jake Davis Analytics, this is an easy question to answer” you might say. And maybe you’re right!1. We can just simply look at players that have the highest completion percentage of all time - obviously, the more passes you complete relative to your attempts tells us if you’re good at completing passes!
Okay, so let’s do this. I collected box score statistics for every game since 1950 for every player that attempted at least one pass, and then build a series of databases to summarize every game, every season, and then the career of all players that attempted at least one pass in NFL2 history. I calculated completion percentage as the number of completions divided by the number of attempts, and viola, we have our answer.
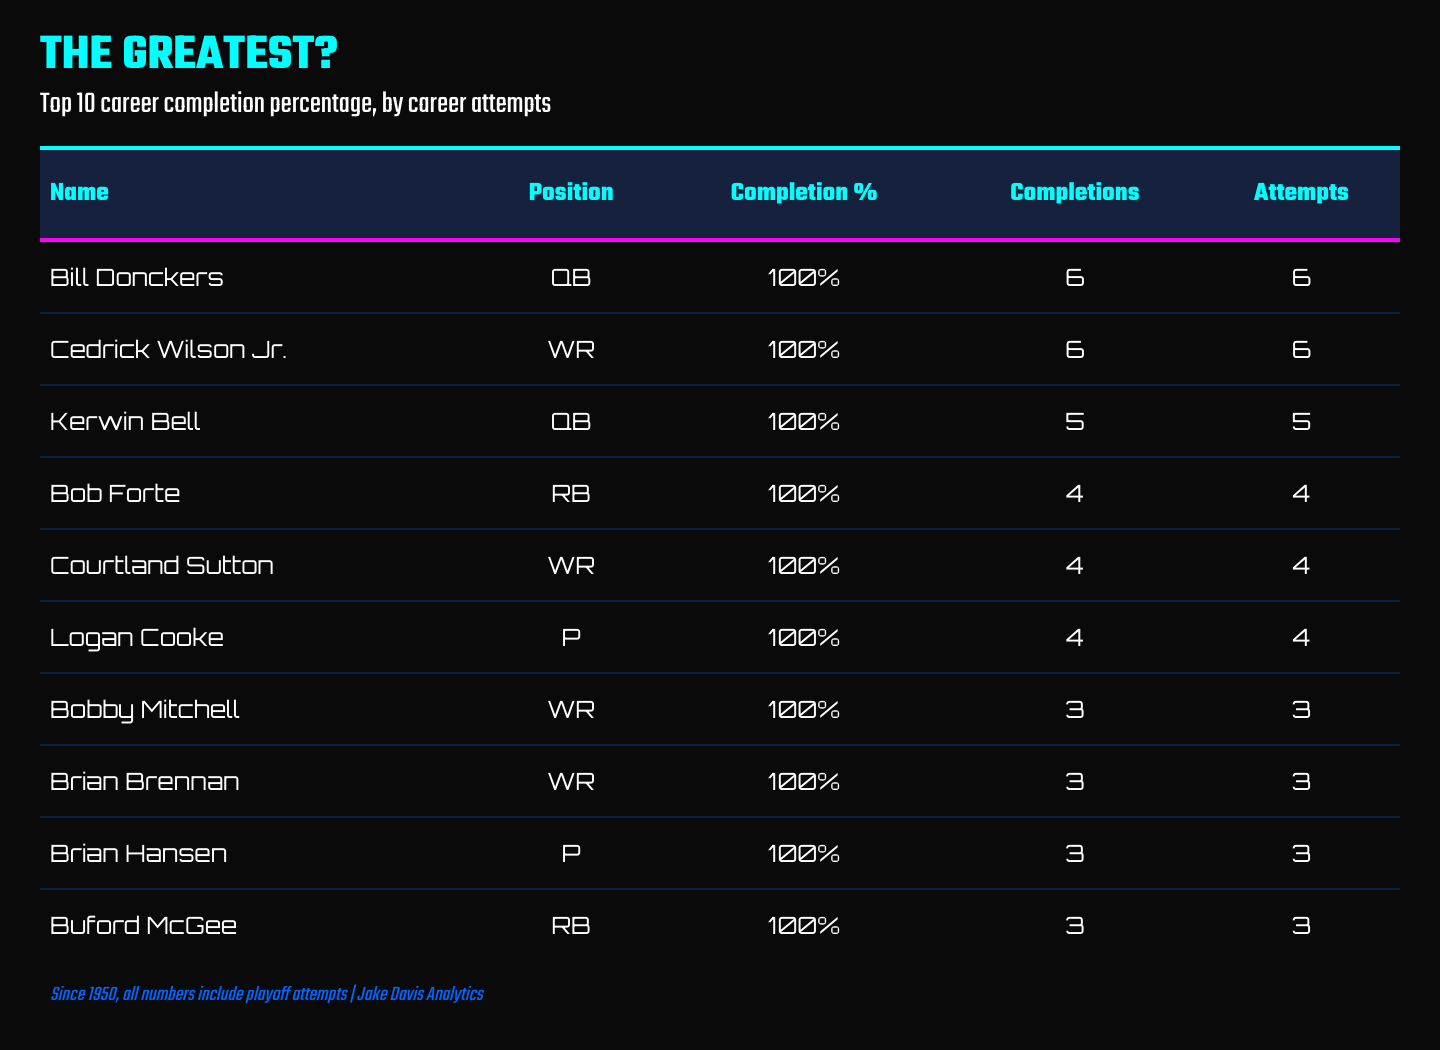
Boom - Bill Donckers and Cedric Wilson, Jr. - we’re done here.
But wait, you shout into the void3 - this doesn’t make any sense! How can Bill Donckers, a two year backup from the late 1970s, and Cedric Wilson, Jr, a spot-starting WR with 7 years in the league and mediocre receiving statistics, be the greatest completer of passes of all time? They’ve barely thrown the ball!
You’re right, I whisper. This doesn’t make any sense4, at least in the spirit of the question. After all, 249 players in my database have a 100% lifetime completion rate (77% of those players attempting only a single pass). So let’s turn to another method, and place a minimum attempts filter on the list. I’ll use 1,500, in accordance with Pro Football Reference’s database
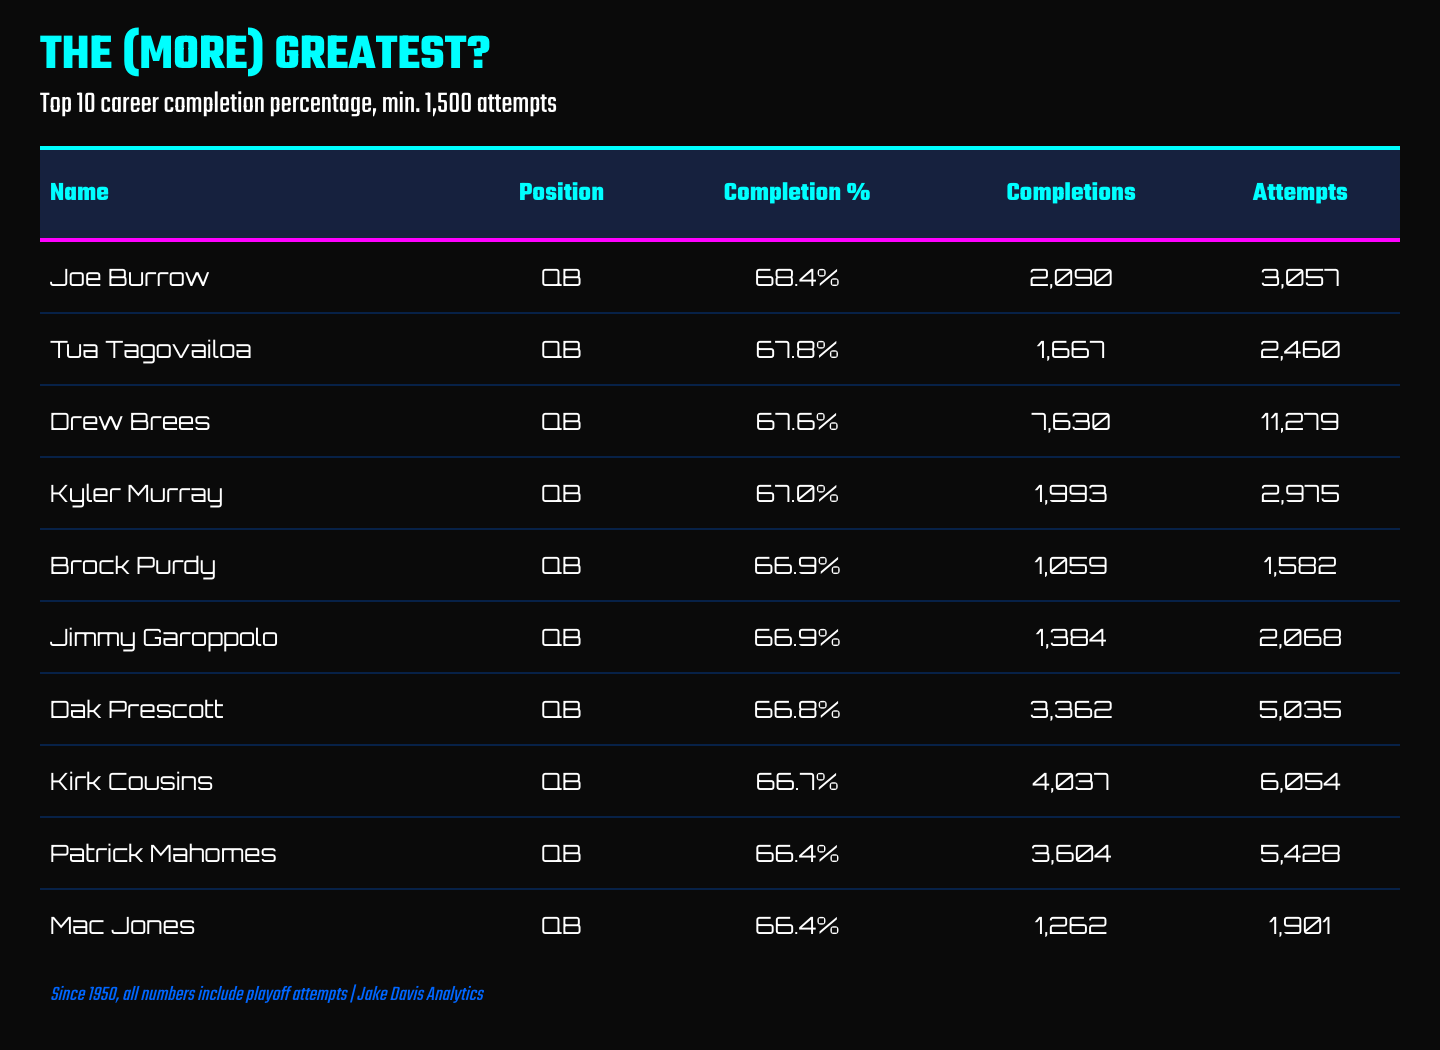
Oh look at that, Joe Burrow (and Tua? and KYLER?? lol cute). There are some reasomable QBs on this list (Burrow, Brees, Dak, Mahomes), but it certainly feels a little…let’s call it recency bias-y. And I doubt anyone who’s watched Mac Jones play think he’s the 10th greatest completer of passes of all time! Hell, all but Brees are actively in the NFL, right now. Moreover, the crude instrument of this filter has eliminated the ability to answer the original motivating question regarding non-QB passers - running backs don’t throw the ball 1,500 times in their career.
Okay, so let’s look at this a different way - let’s examine the relationship between passign attempts and completion percentage, since the 1,500 threshold feels a bit arbitrary
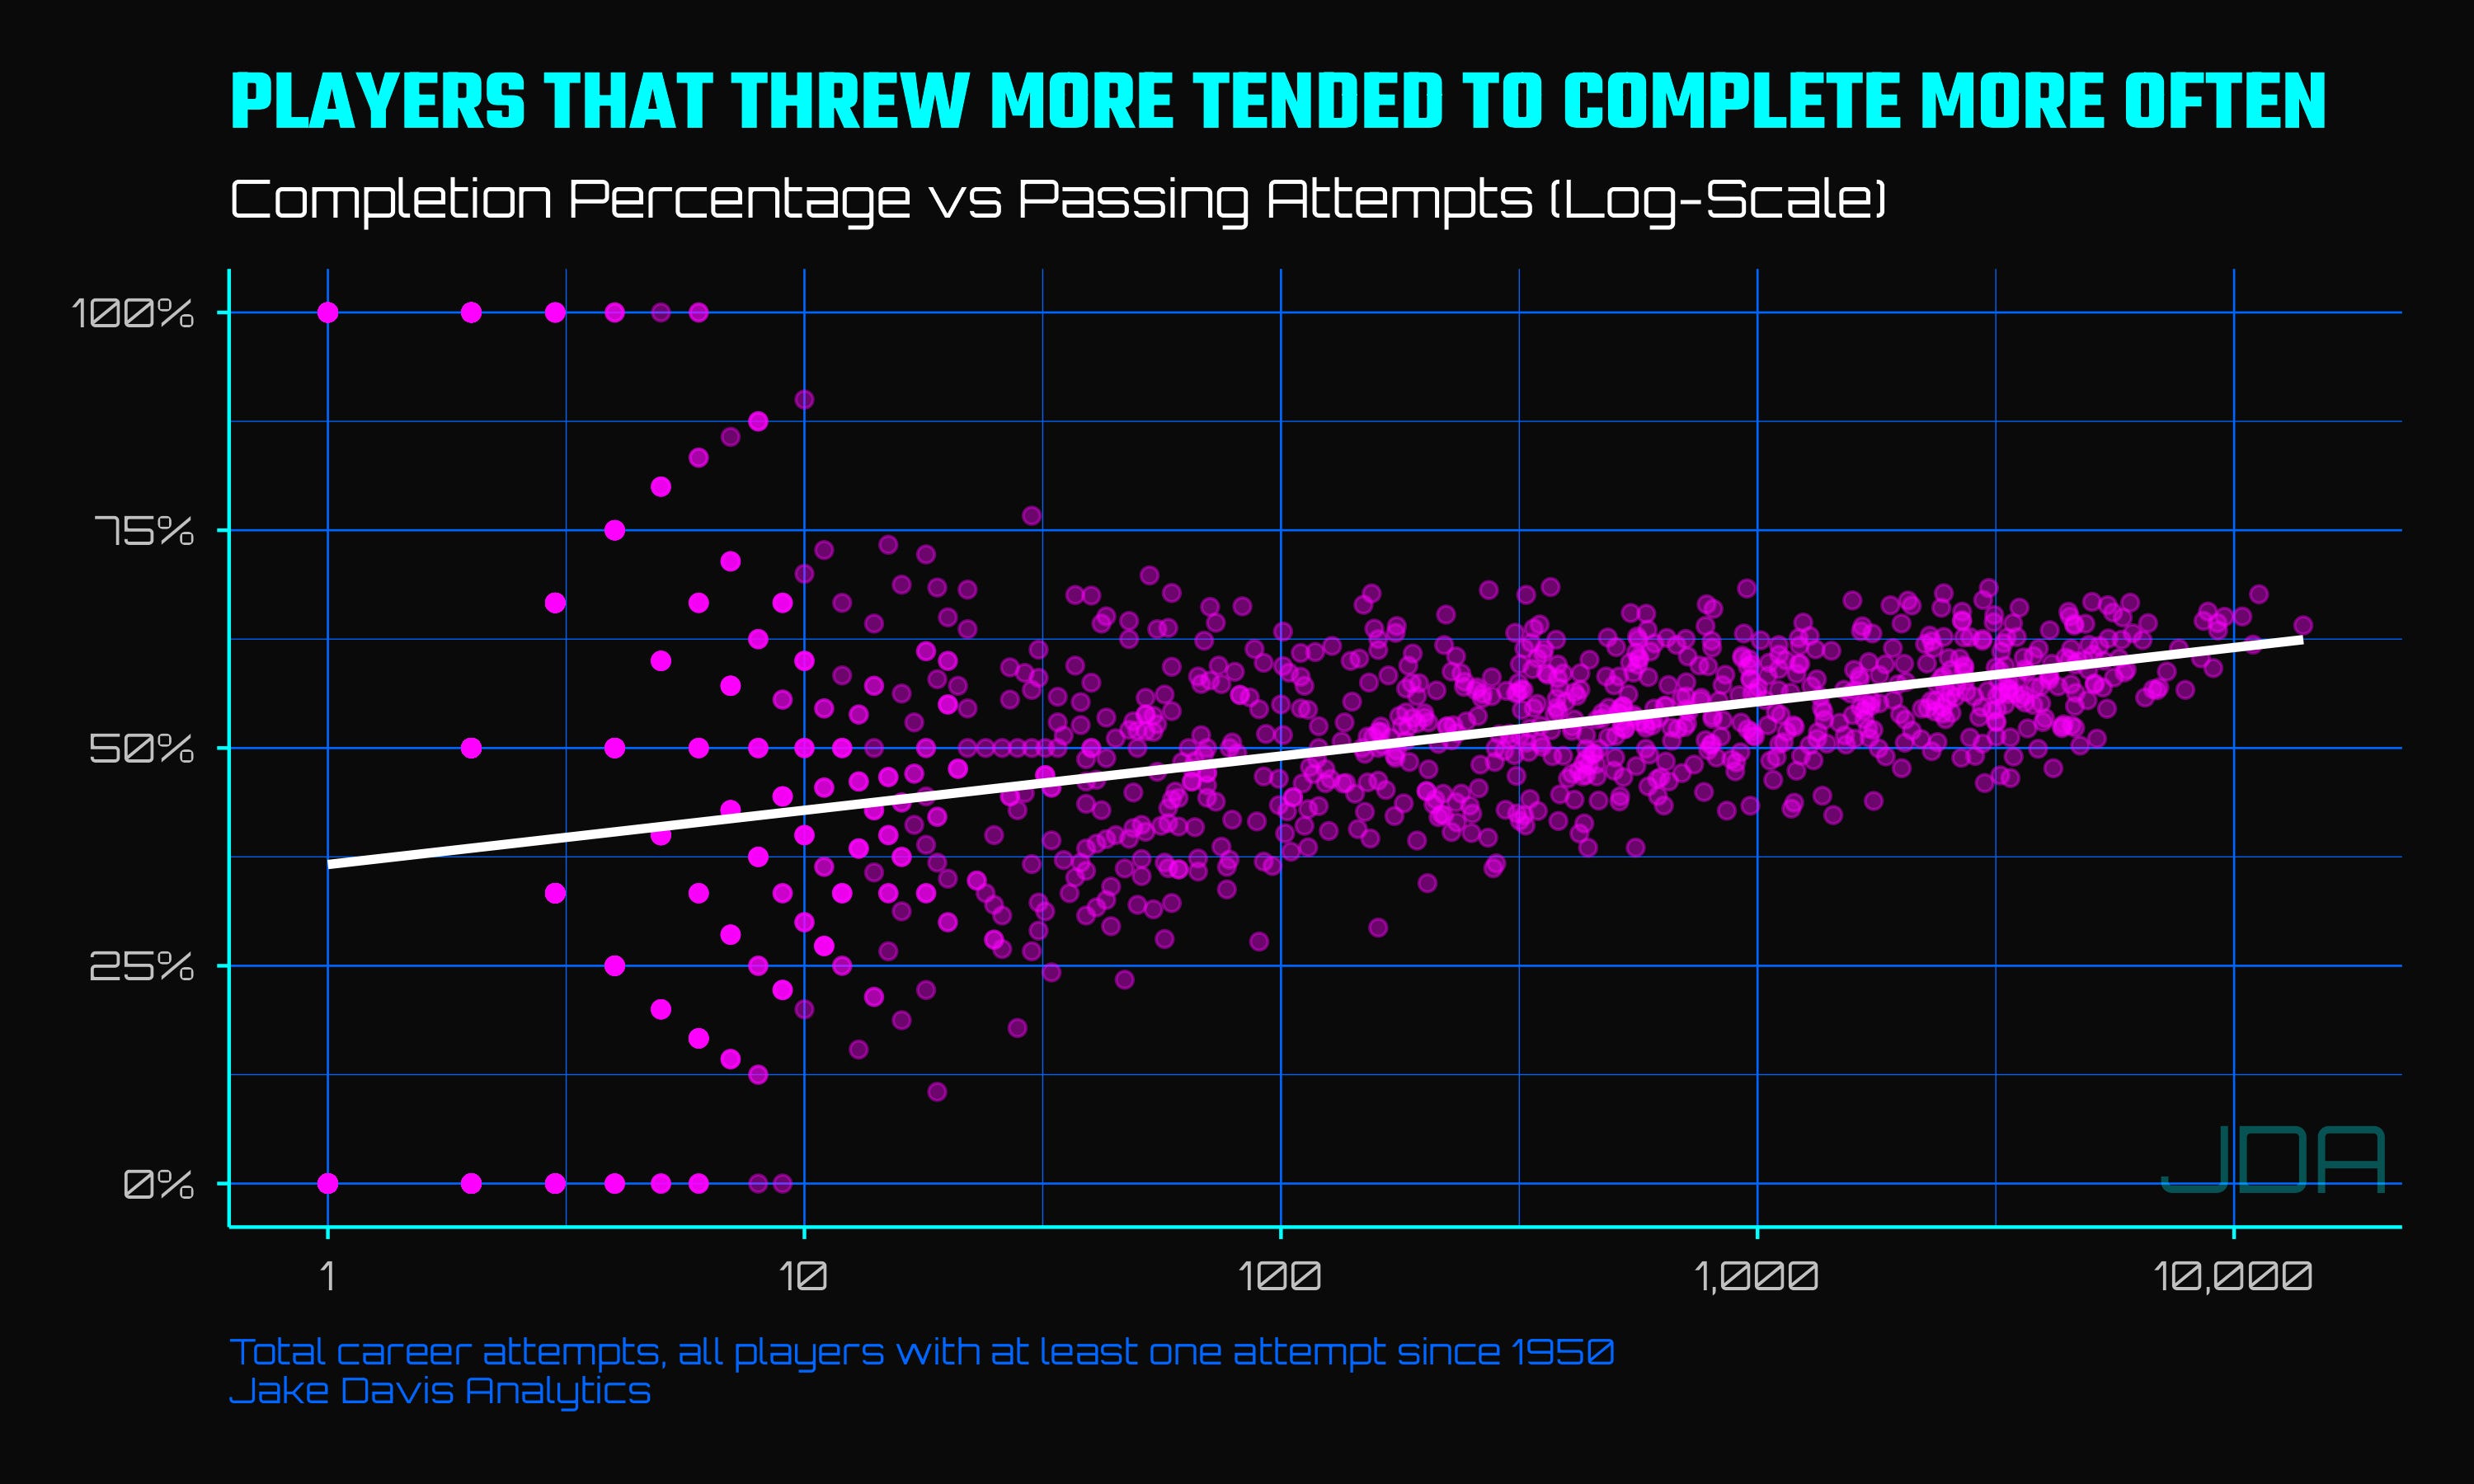
it may seem counter-intuitive, but the relationship between attempts and completion percentage is postive5, which is only surprising because volume and rates tend to be mildly negatively correlated. But in this case, it makes perfect sense - if you’re bad at completing passes, you probably don’t get to have many passing attempts. So there is some selection bias at play here, which will make drawing a conclusion on the greatest completer of passes trickier than initially thought. One other thing to notice from the chart above is that the spread of dots doens’t seem to noticeably collapse at 1,500 attempts. So we might as well see how the greatest completer, in terms of raw percentage, changes based on different attempts thresholds.
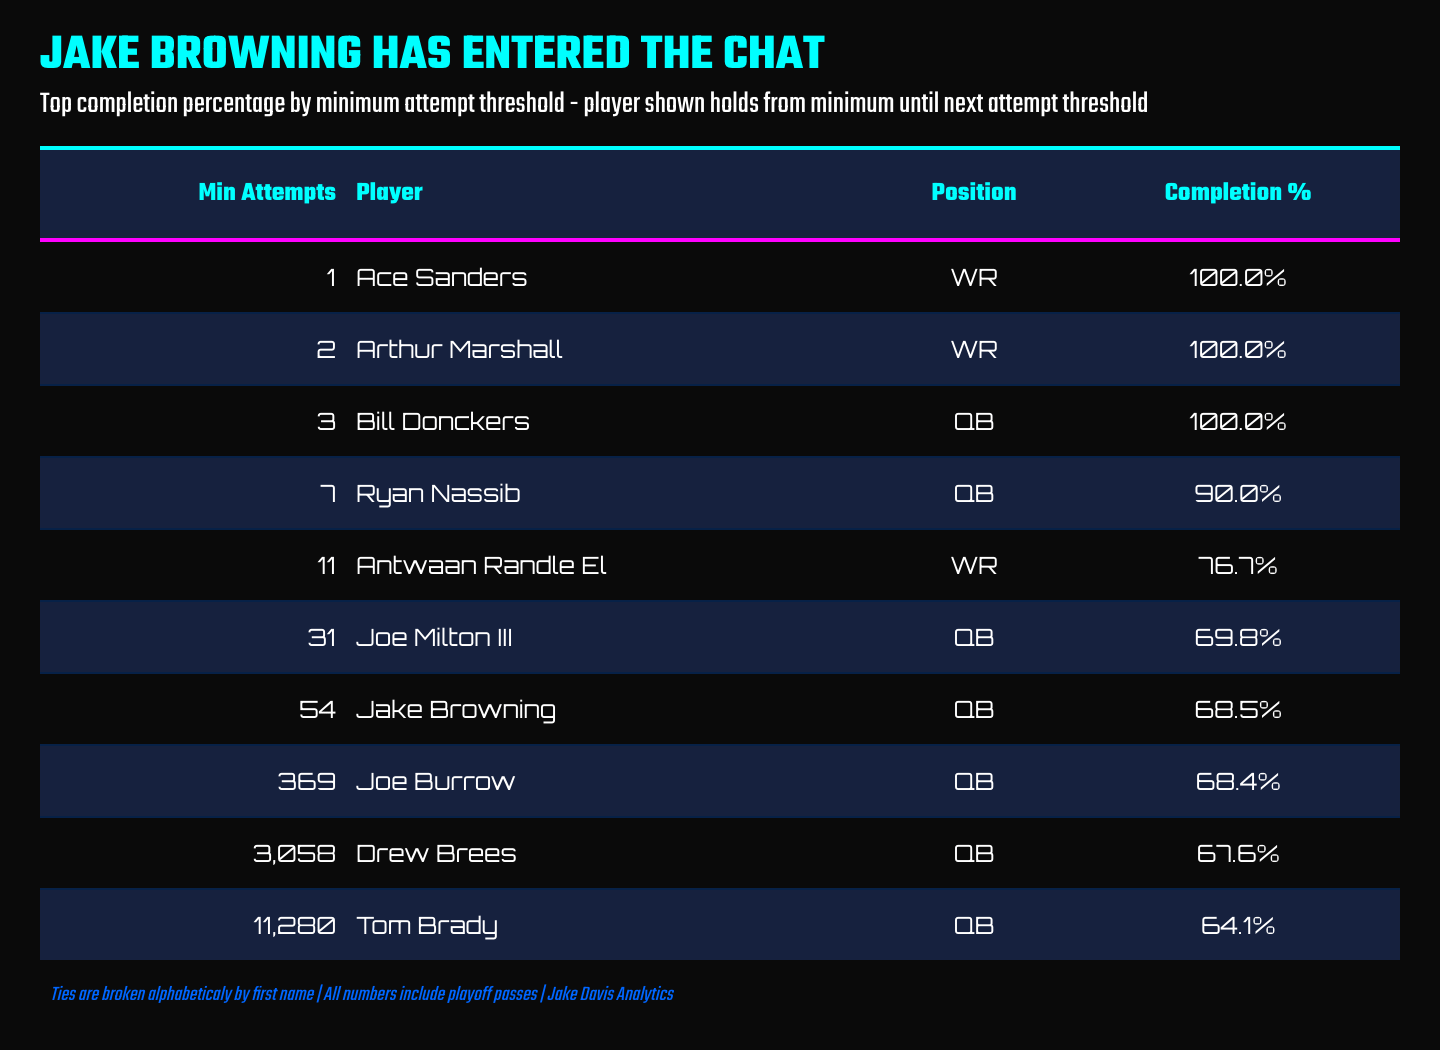
Jake Browning, of all people, may be the greatest completer of passes…if you randomly choose a 315-attempt wide window6. While interesting, this breakdown doesn’t really tell us much new - the top completion percentage based on a minimum number of attempts tends to hover around 68% - and tends to be biased towards recent passers.
When completion percentage is examined longitudinally, an obvious and steep slope is apparant7 , growing from from sub-50% completion percentage in 1950 to a league average 64% rate in 2025.
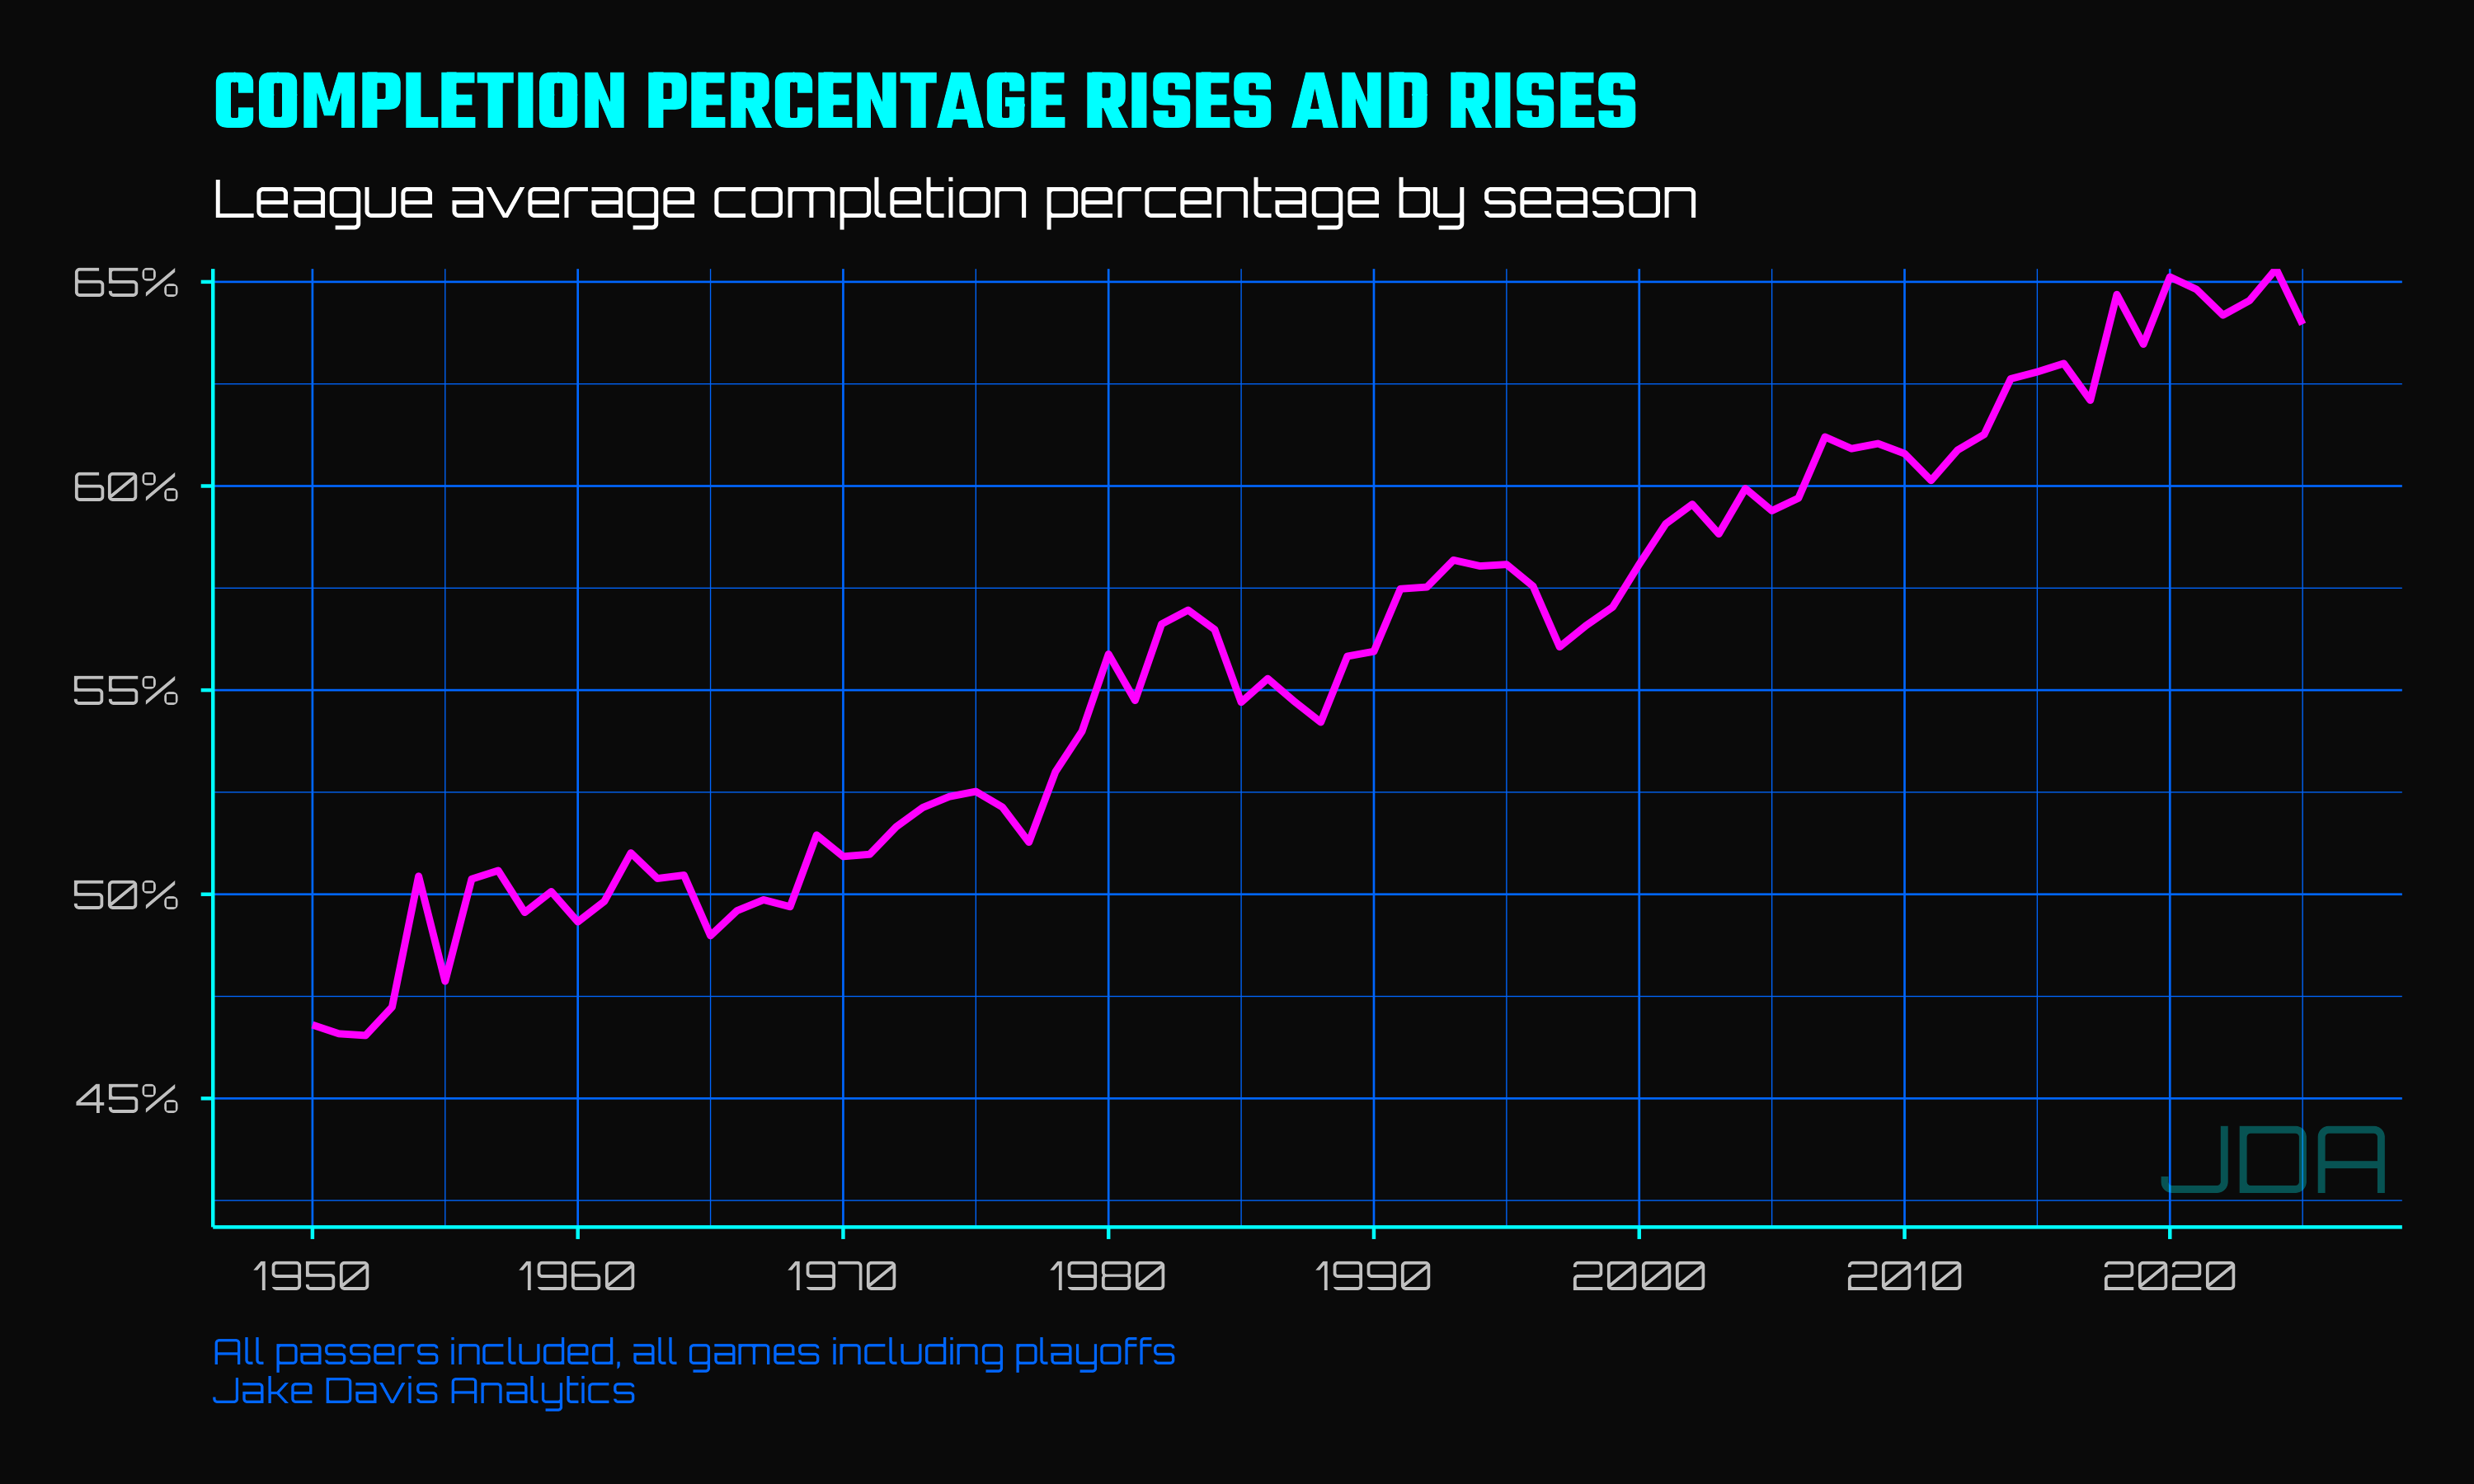
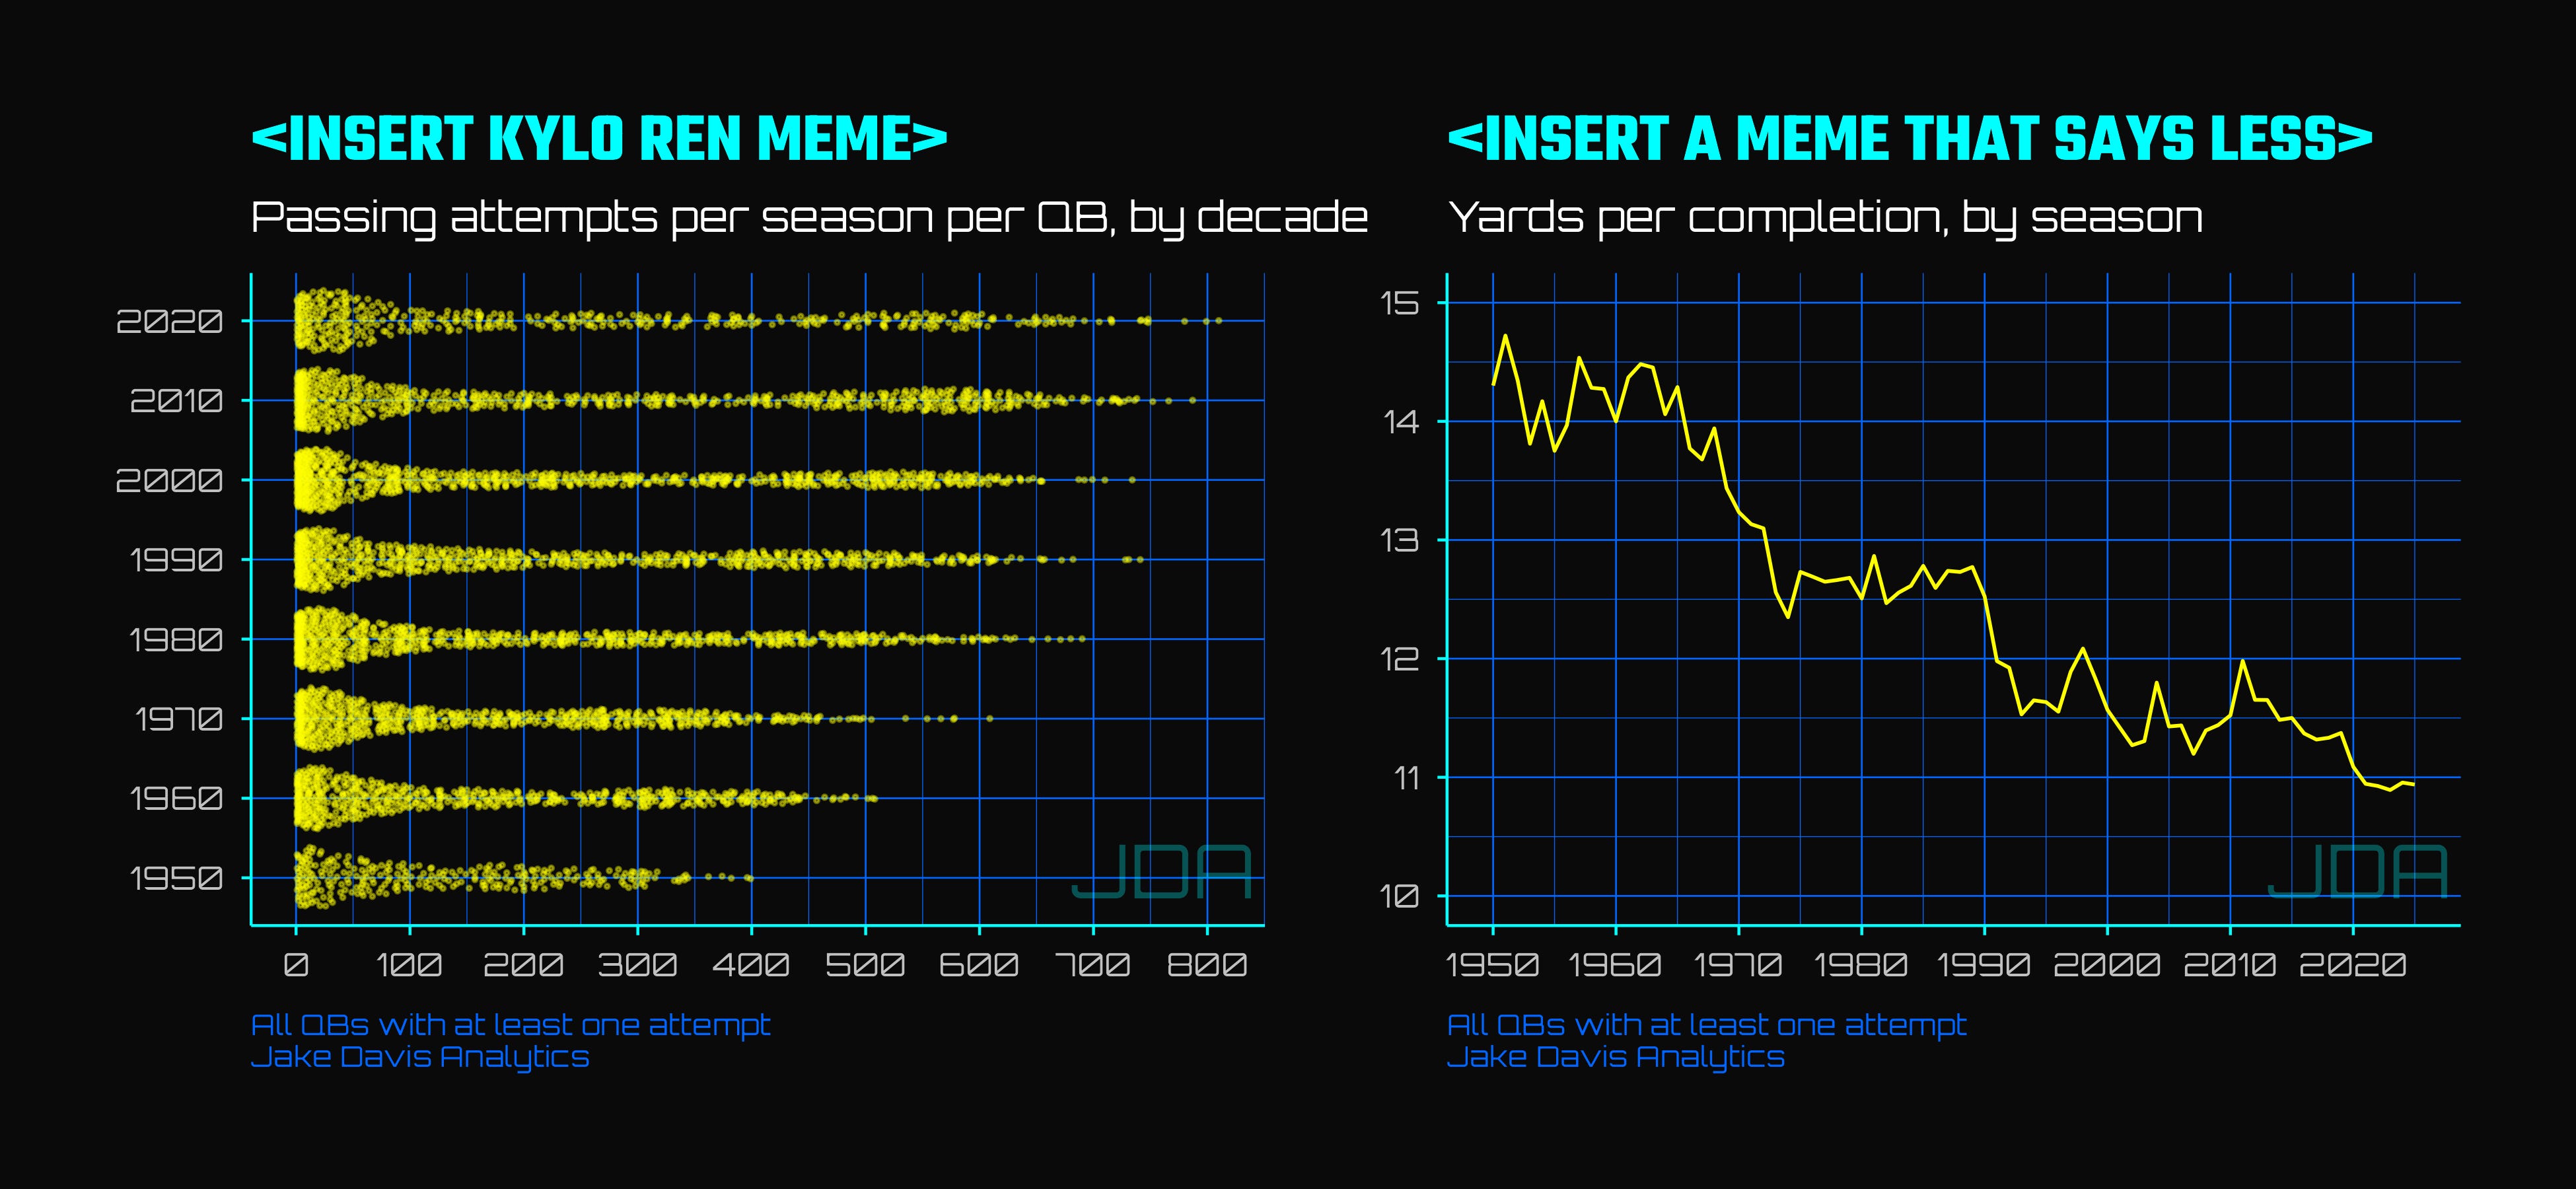
But does this inherently mean modern day passers are better than the throwers of yesteryear? Not necessarily! For one thing, professional football has evolved dramatically over the decades - a game in 2020, while recognizably the same game as one played in 1970, is still a radically different form of the game. Passers are attempting (and completing) far more passes per game8, but those passes are going for far fewer yards9. While my dataset doesn’t include air yards (how far the ball traveled in the air), yards per completion is a fair proxy. And the decline suggests modern passers are attempting easier throws - perhaps due to scheme, perhaps due to better decision-making or some other factor - than older passers.
Moreover, modern passers have a very different training environment - Juan Jennings, for example, threw 377 passes in high school (222 in his senior year), compared to someone like Bart Starr, who threw 122 passes as a senior as a highly touted recruit. These dynamics play10 out in the form of a “rising tide lifts all ships” kind of way, as evidenced by the shrinking distance between the best and worst passers in any given season as time goes on. To illustrate this, on the top is a chart that shows the spread of completion percentage by season, and on the bottom is the summarized coefficient of variation11 of each season’s completion percentage.
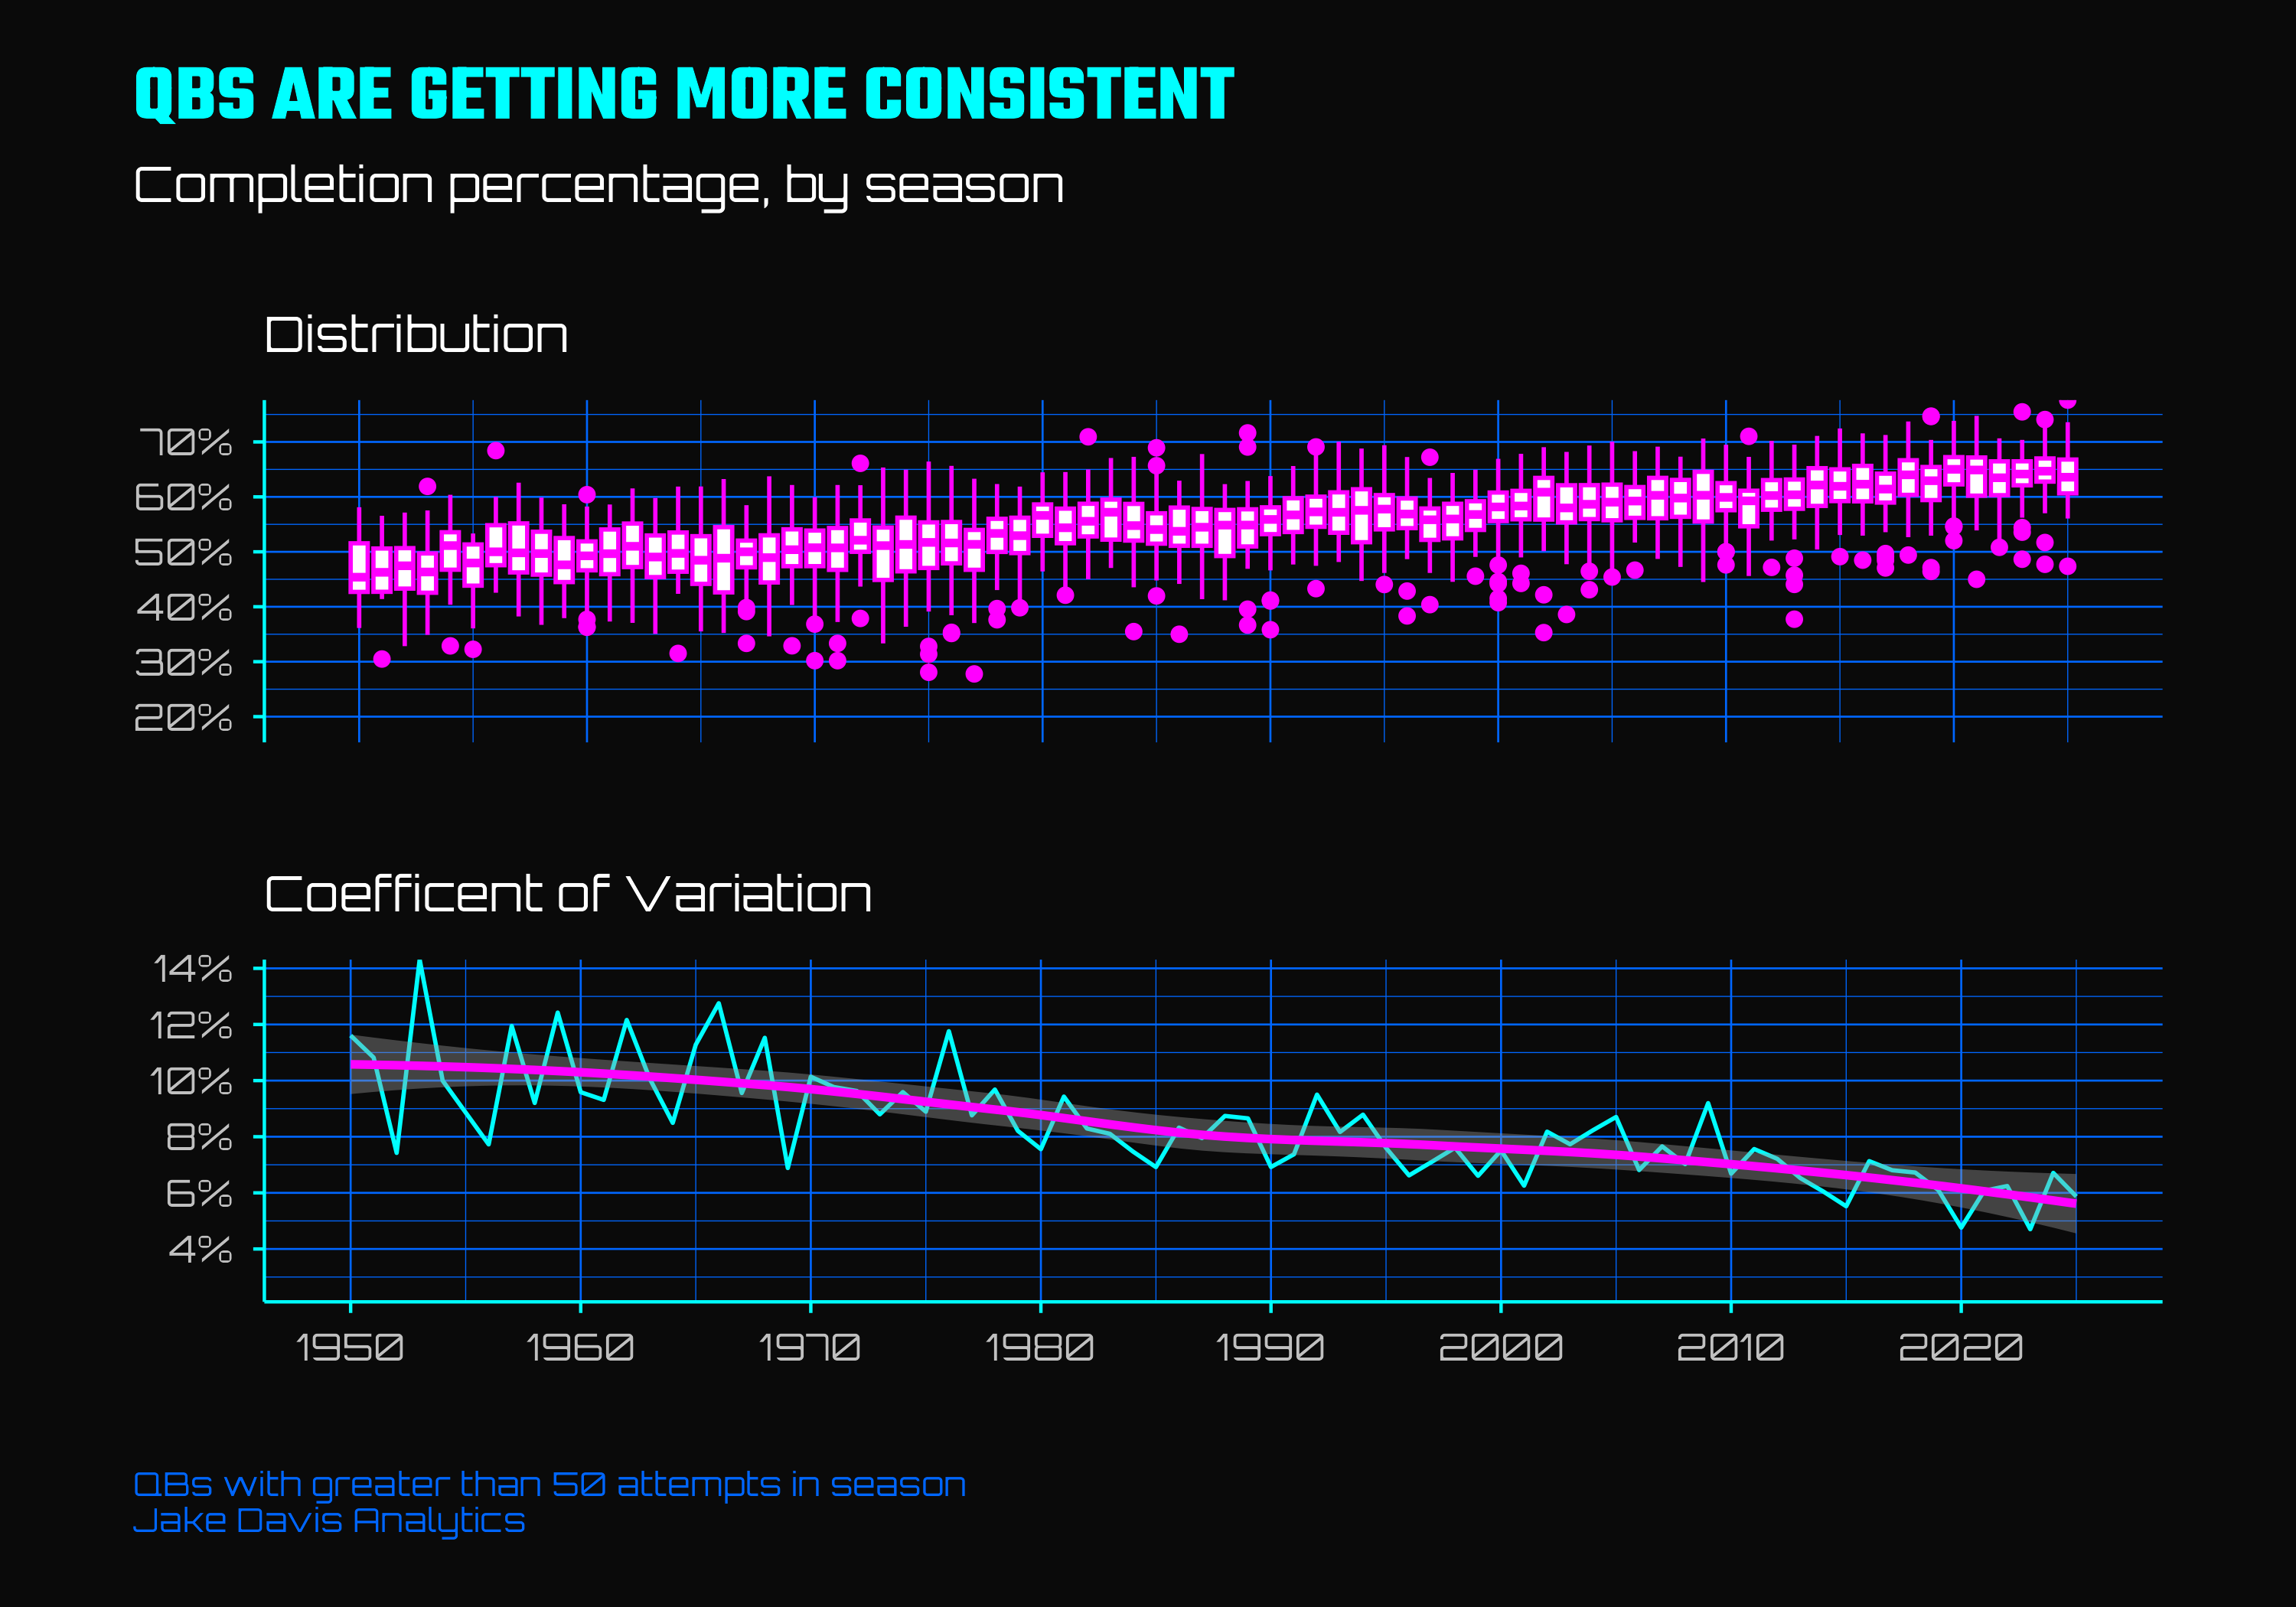
If the chart above wasn’t clear enough, the CV chart makes it obvious - the standard “spread” of season-long completion percentage amongst QBs is shrinking. Stated in another way - the distance between good and bad QBs is shrinking over time.
So the motivating question of this post - who is the greatest completer of passes of all time - sure has gotten complicated. Position, the number of attempts, and the impacts of era all make what should be a simple counting and dividing exercise anything but. Thankfully, there is a tool for this - statistical modeling.
A statistical model is a useful mechanism for answering questions that appear simple on the surface but contain a myriad of complexities. To help answer this specific question, I fit a hierarchical statistical model12 meant to decompose the impact of postion, era, evidence in the form of attempts, and individual player impacts.
Philosophically, the model is designed to help make sense of a straightforward question: When a quarterback completes 75% of his passes over 50 attempts, should we believe he’s truly a 75% passer? Probably not. Small samples are noisy, and results tend to drift towards average as more data is gathered - a phenomenon called regression to the mean. Hierarchical models like the one I fit formalize this intuition through a concept called shrinkage - rather than taking each player’s stats at face value, the model blend their observed performance with what it knows about typical passers. A backup with 50 attempts at 75% gets pulled heavily toward the league average; a starter with 5,000 attempts at 68% stays close to his observed rate. The math borrows from Bayesian reasoning - start with prior belief about plausible completion percentage, then update as evidence accumulates. More data means more trust in individual results - less data means more reliance on the overall average. The result is a set of estimates that are skeptical of outliers but reward sustained performance - exactly what is needed to begin to assess a concept of the “best.”
But shrinkage alone doesn’t solve a deeper problem - a 62% completion rate meant something different in 1975 than it does today. Statistical models can address this by encoding the observed completion percentage into distinct components mentioned above. Effectively, the model is asking: Given when this player played, what position he played, and how many passes he attempted, what’s our best estimate of his underlying accuracy? Because the model specification contains both fixed effects - variables that don’t vary at the local level such as era and position - and random effects - variables that do vary at the local level such as individual player skills, you can strip away the fixed environmental factors and be left with the player effects themselves13. I call this the isolated completion effect: the expected completion percentage if every passer played in the same neutral environment. Now I can compare passers from any era (and from any position) on equal footing14, accounting for the inherent differences in position and era to credit and discount observed numbers where appropriately.
Phew - that was a lot of jargon, so it’s time to show the goods. So without further ado, the greatest passers of all time, at least according to my model.
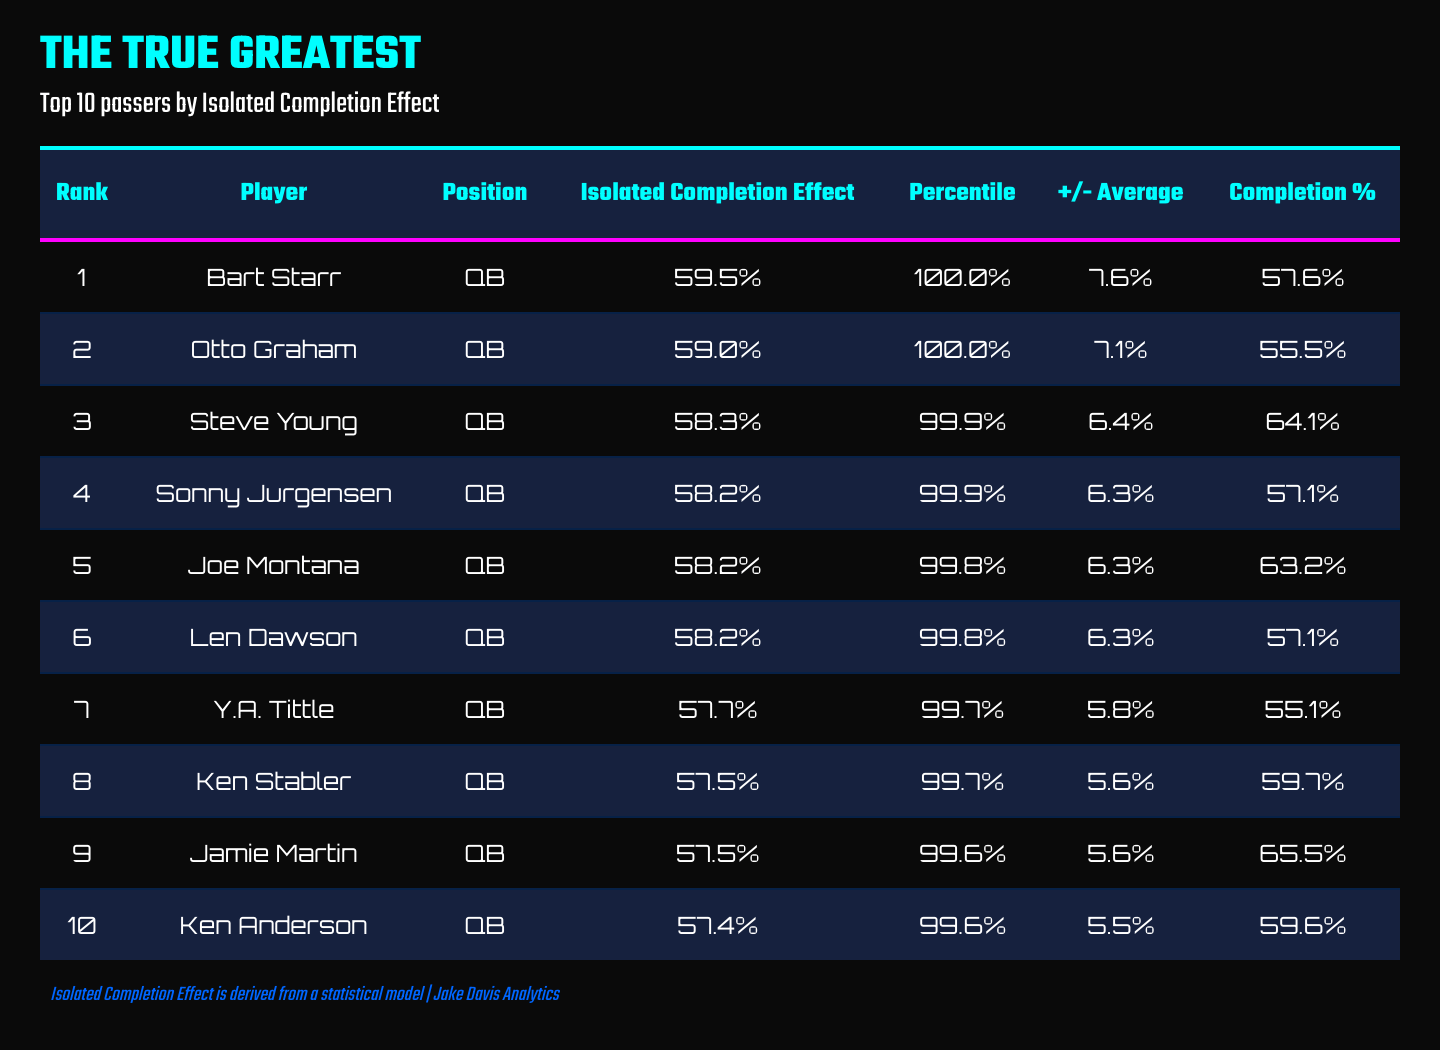
Bart Starr - one of the OG “greatest QBs of all time” - rises to the top as the new greatest completer of passes. This makes some intuitive sense - Starr led the league in completion percentage four times15, was an outstanding postseason passer16, and had an average completion percentage 12% higher than the median passer of his generation - the third highest of all time when organizing passers by decade:
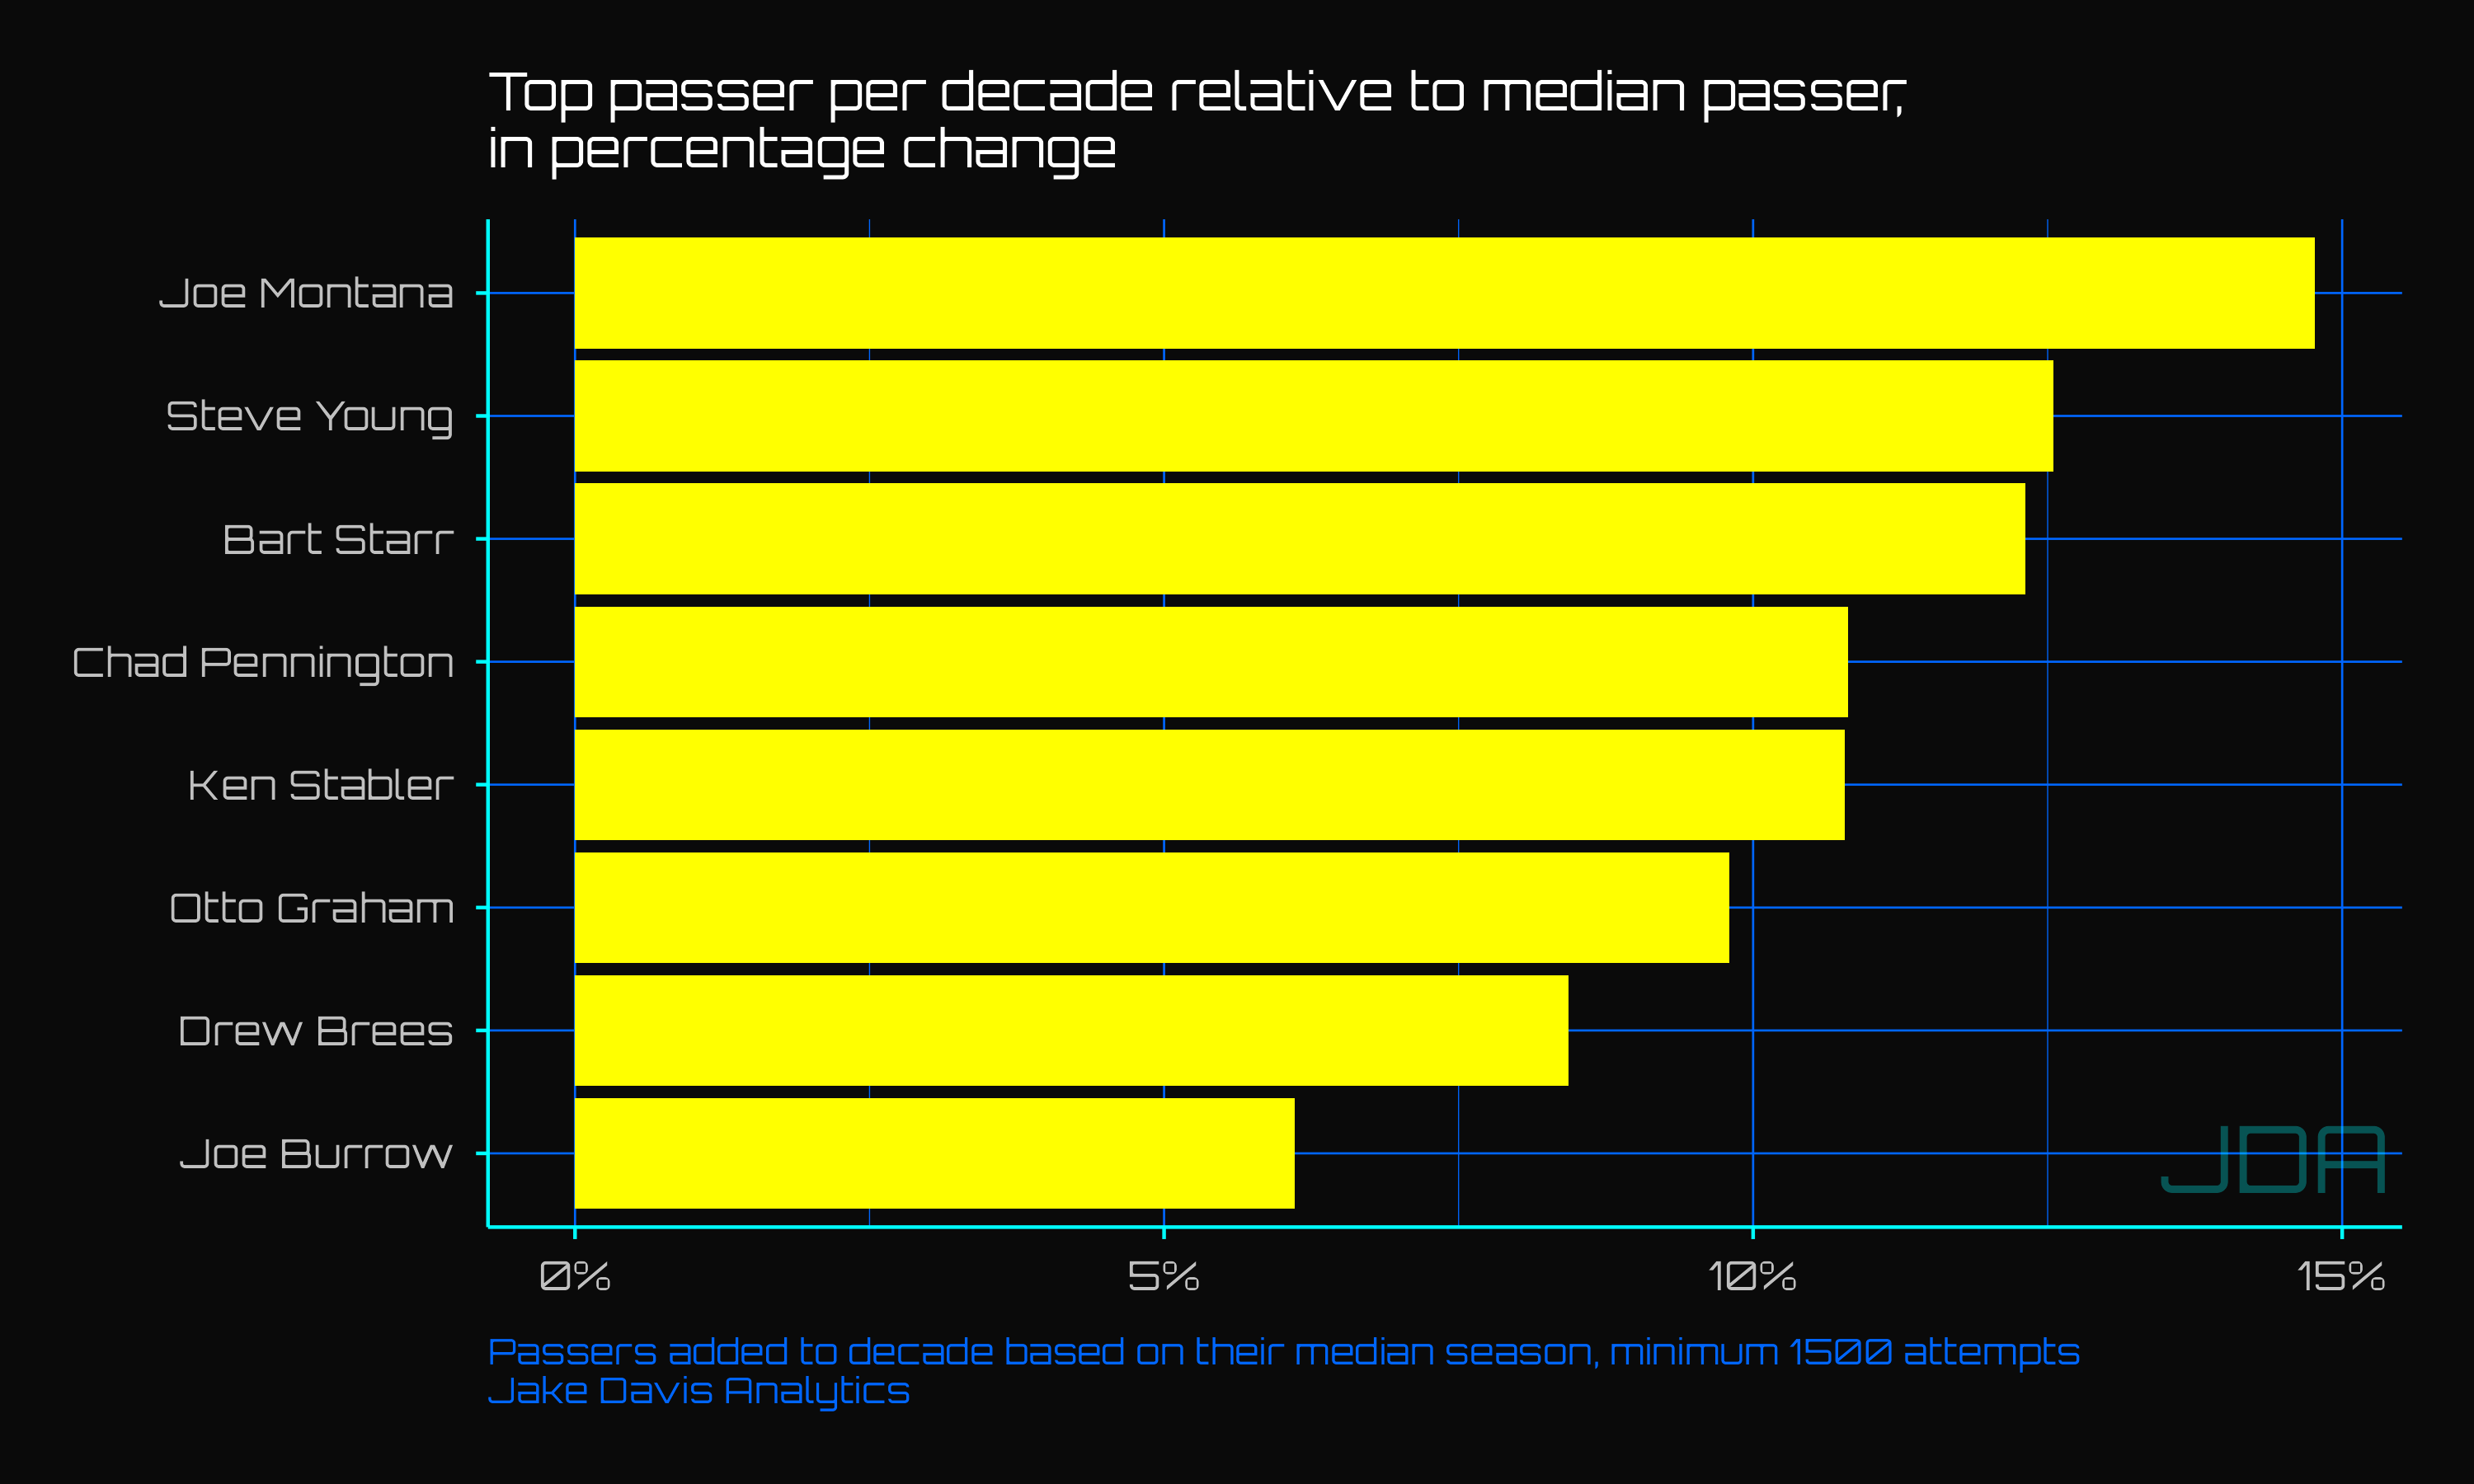
Starr’s Isolated Completion Effect benefits massively from his era adjustment - accourding to the model, the 1960s passing environment cost him about 6 percentage points compared to a more “neutral” environment. Using Drew Brees as a point of comparison, the model believes that had Starr had played in Brees's era, he'd have completed roughly 65% of his passes. If Brees had played in Starr's era, he'd have completed about 51%.
Now you might disagree with this assessment, and sure, the model isn’t the most sophisticated or well-specified1718, but it does start to reveal some interesting aspects of completing passes, as well provide tooling for additional “what-if” scenarios that simple counting and filtering metrics don’t allow. Let’s run through a few that stuck out to me.
Shinkage helps adjust observed completion percentage when accounting for evidence and era
One of the core elements of a statistical model is that it can still produce “expected” outcomes, even if it already has “seen” the observed outcome in the training data. These predictions can be thought of as shrinkage towards the mean when there isn’t enough evidence. As a secondary benefit, the model can also produce credible intervals in which the “real” outcome might sit. This is useful to try to understand what a “true” completion percentage might in the absence of information.
Let’s look at Cortland Sutton, who has gone 4 for 4 in his career passing on trick plays - his shrunken “true” estimated completion percentage is 49.4%, with a 95% confidence range of 42.3% - 56.5%. Or, for more fun, take fellow Bronco “QB” Kendall Hinton - who famously played an entire game at QB for Denver when the rest of their QB room was out with COVID. He went 2-10, but the model sees that 20% and thinks “that’s not that much evidence of skill, so let’s estimate the truth as something far closer to average” and suggests Hinton is roughly a 49.7% passer with a likely range of 42.7% - 56.7%. Looks pretty similar to Sutton!
The model is looking at both of those tiny stat lines and basically shrugging, guessing that without more evidence, it makes sense to just view them as likely average.
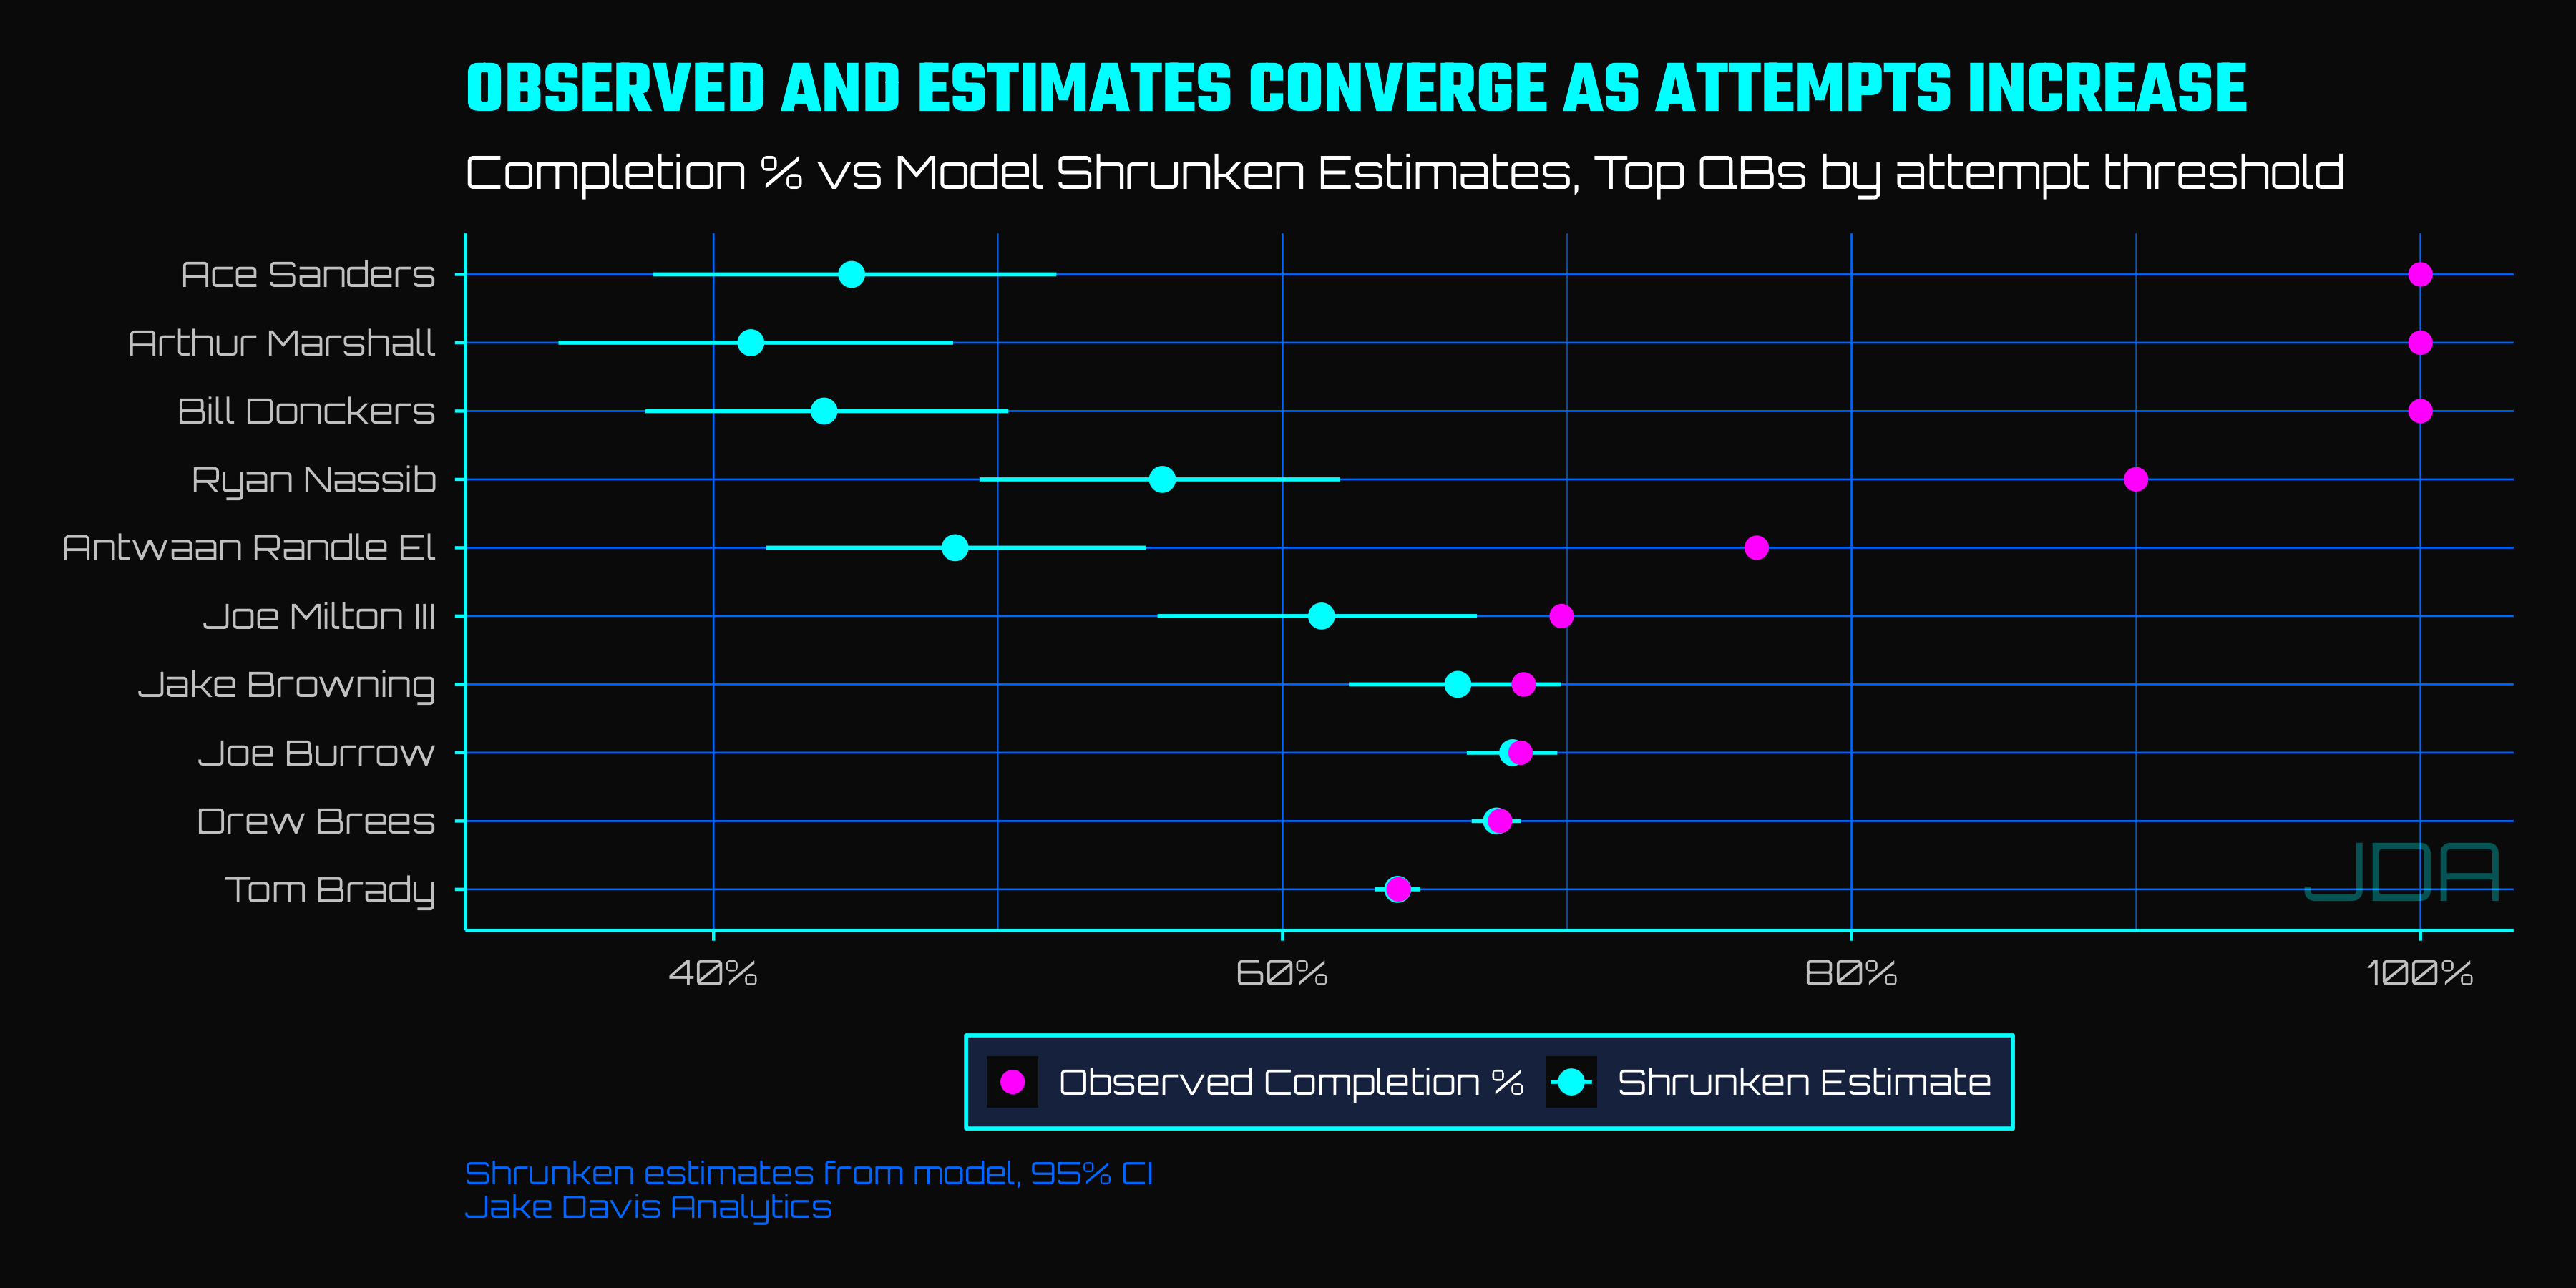
When revisiting the best passers by minimum attempts table from above, shrinkage and observation converge as the number of attempts increase - and uncertainty decreases to the point of non-existence. Tom Brady’s nearly 9,000 attempts leave little room for doubt that he was really completing 64% of them…even if that number isn’t fully attributed to him (Brady’s Isolated Completion Effect is 52.6%, in the 92% percentile). Browning, on the other hand, has a chance that his observed 68% completion percentage is “real”, but the model’s best guess is 66%.
Isolated Completion Effect massively re-configures historical rankings
This chart is pretty wild!
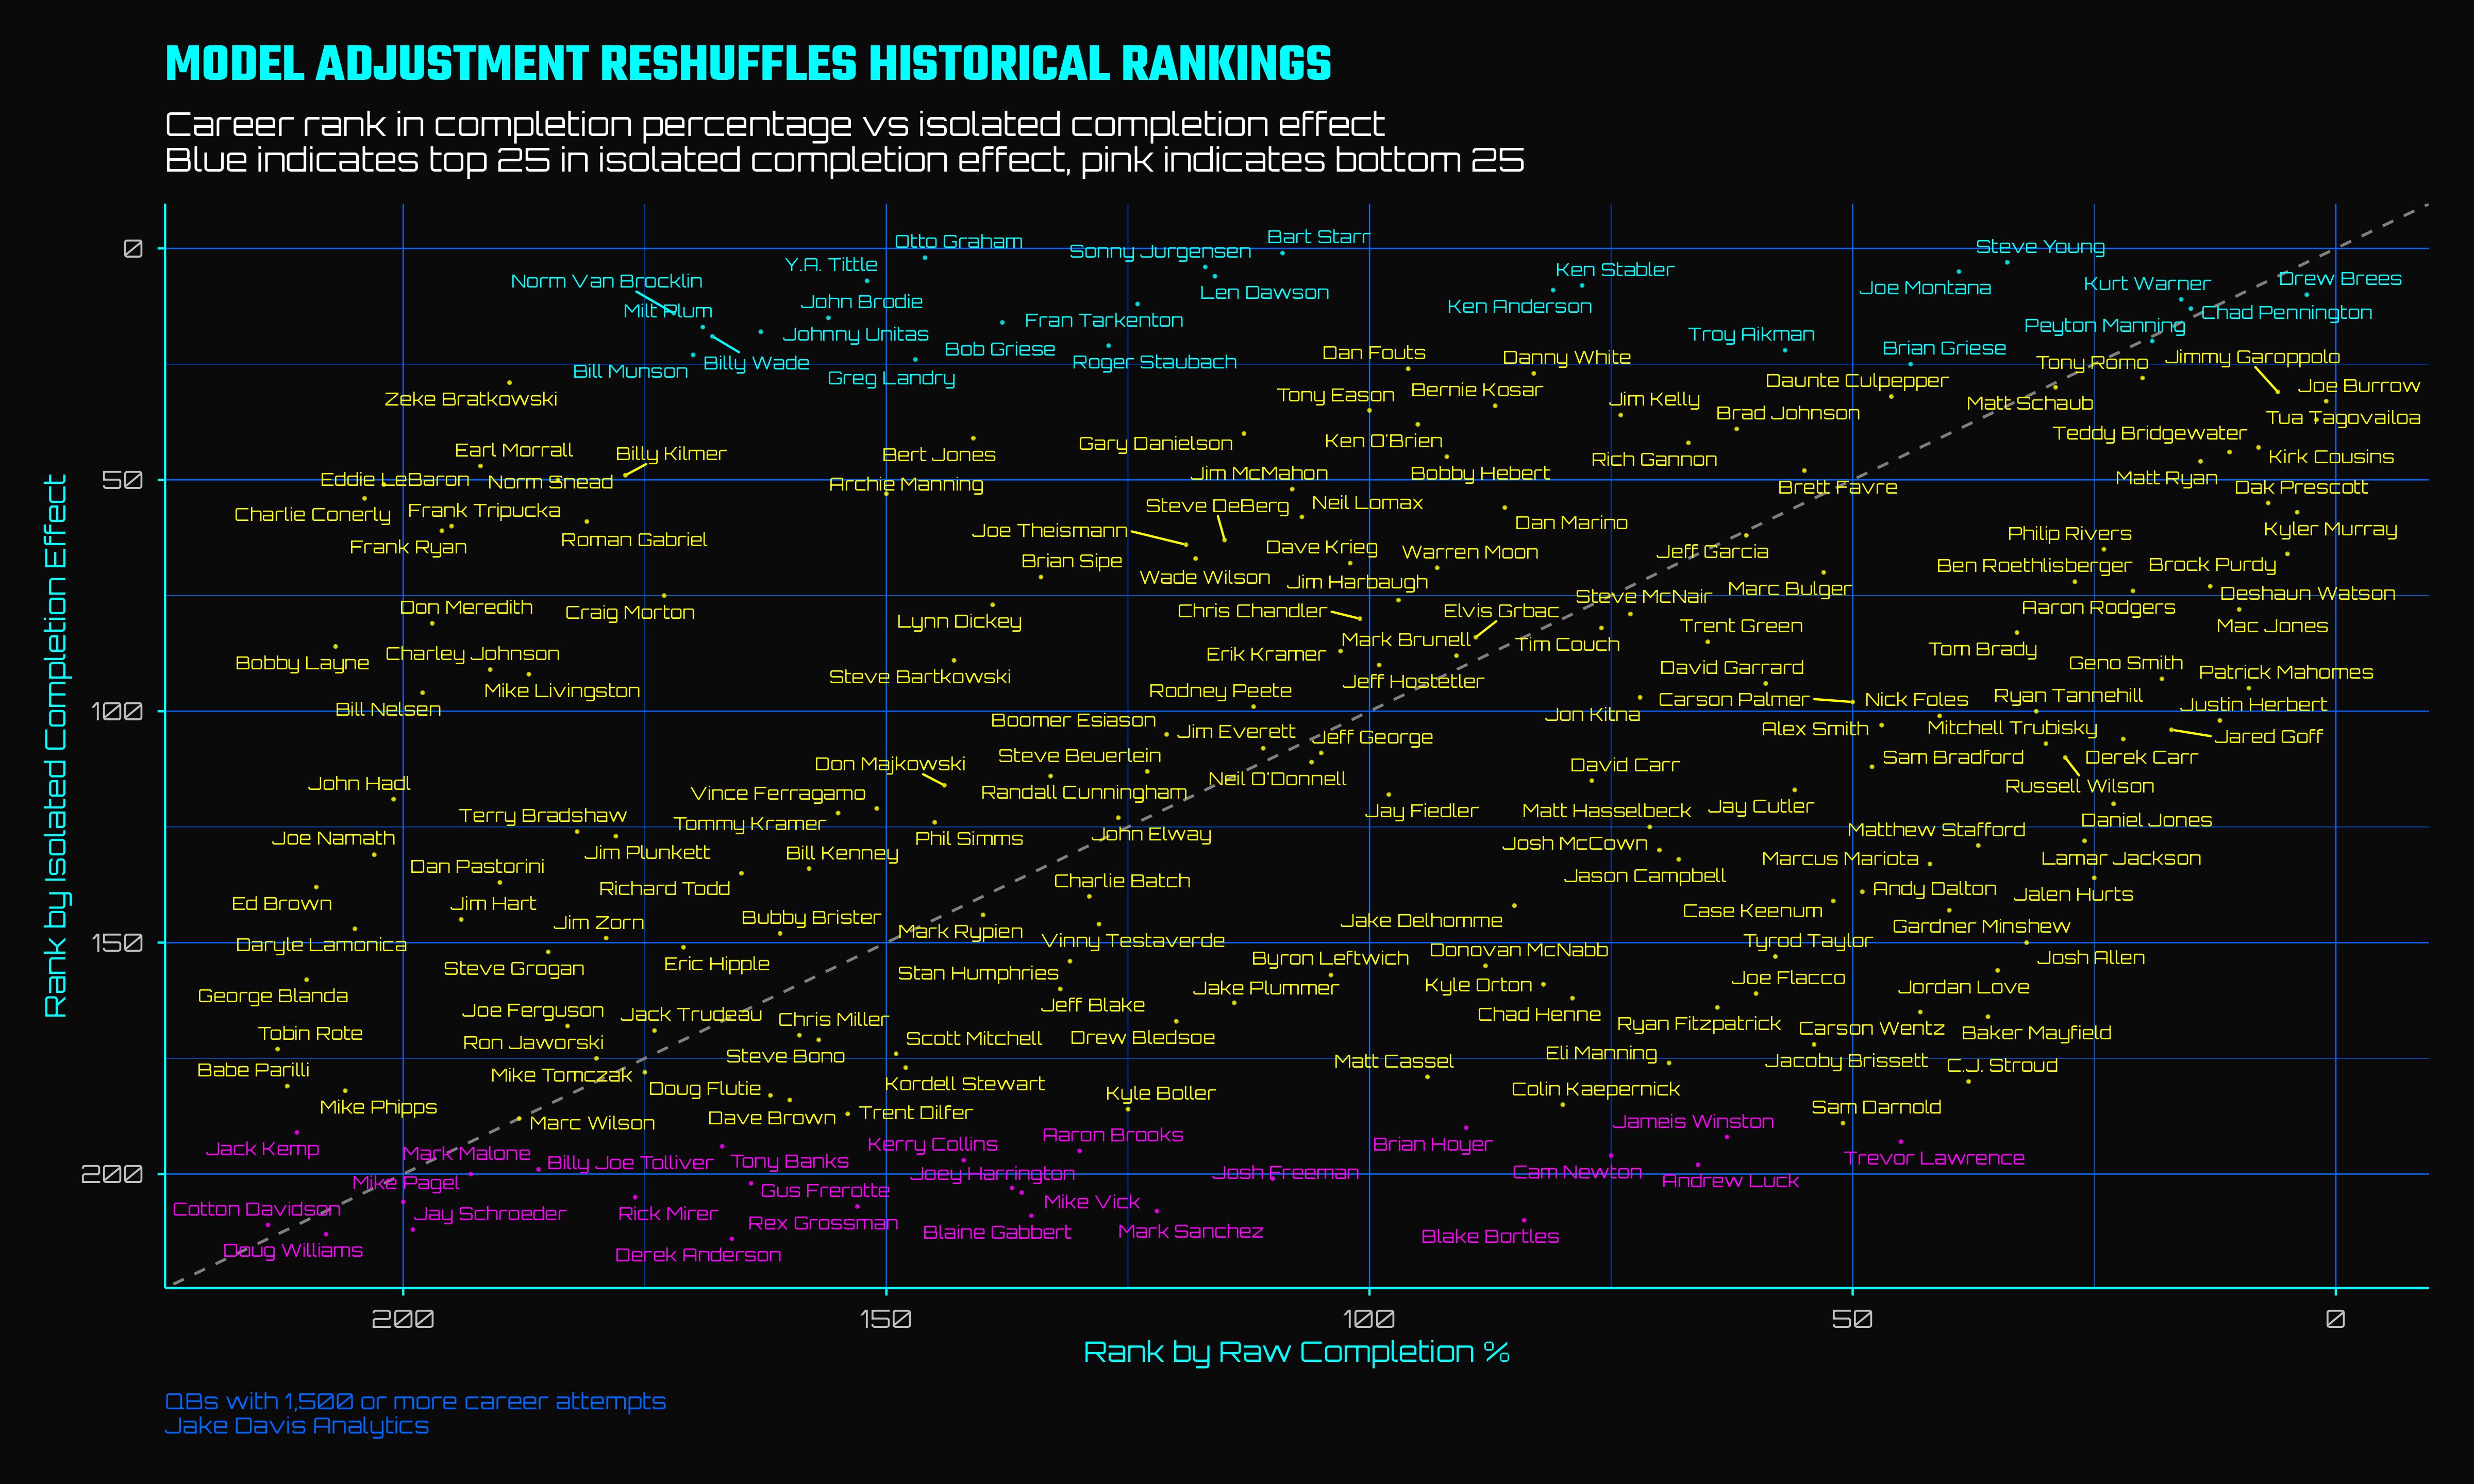
Isolated Completion Effect hates some passers I generally think of as pretty good! Andrew Luck, Kerry Collins, Trevor Lawrence become bottom 25 QBs19, and recent Super Bowl Winner and reclamation case Sam Darnold just misses. Meanwhile, HOF Norm Van Brocklin climbs 156 spots from 172 overall in completion percentage (53%) to 14th in Isolated Completion Effect (57%). I love this chart, and readers can explore the nuances further in the data downloads at the end of the post.
Models can time travel
One of the best aspects of a smart statistical model is that they allow for the concept of the “counter-factual” by changing certain parameters but not others. Let’s take our Isolated Completion Effect GOAT as an example…what if Starr was drafted the same year as Drew Brees? Or in any other decade? The model provides counterfactual’s for anyone to examine
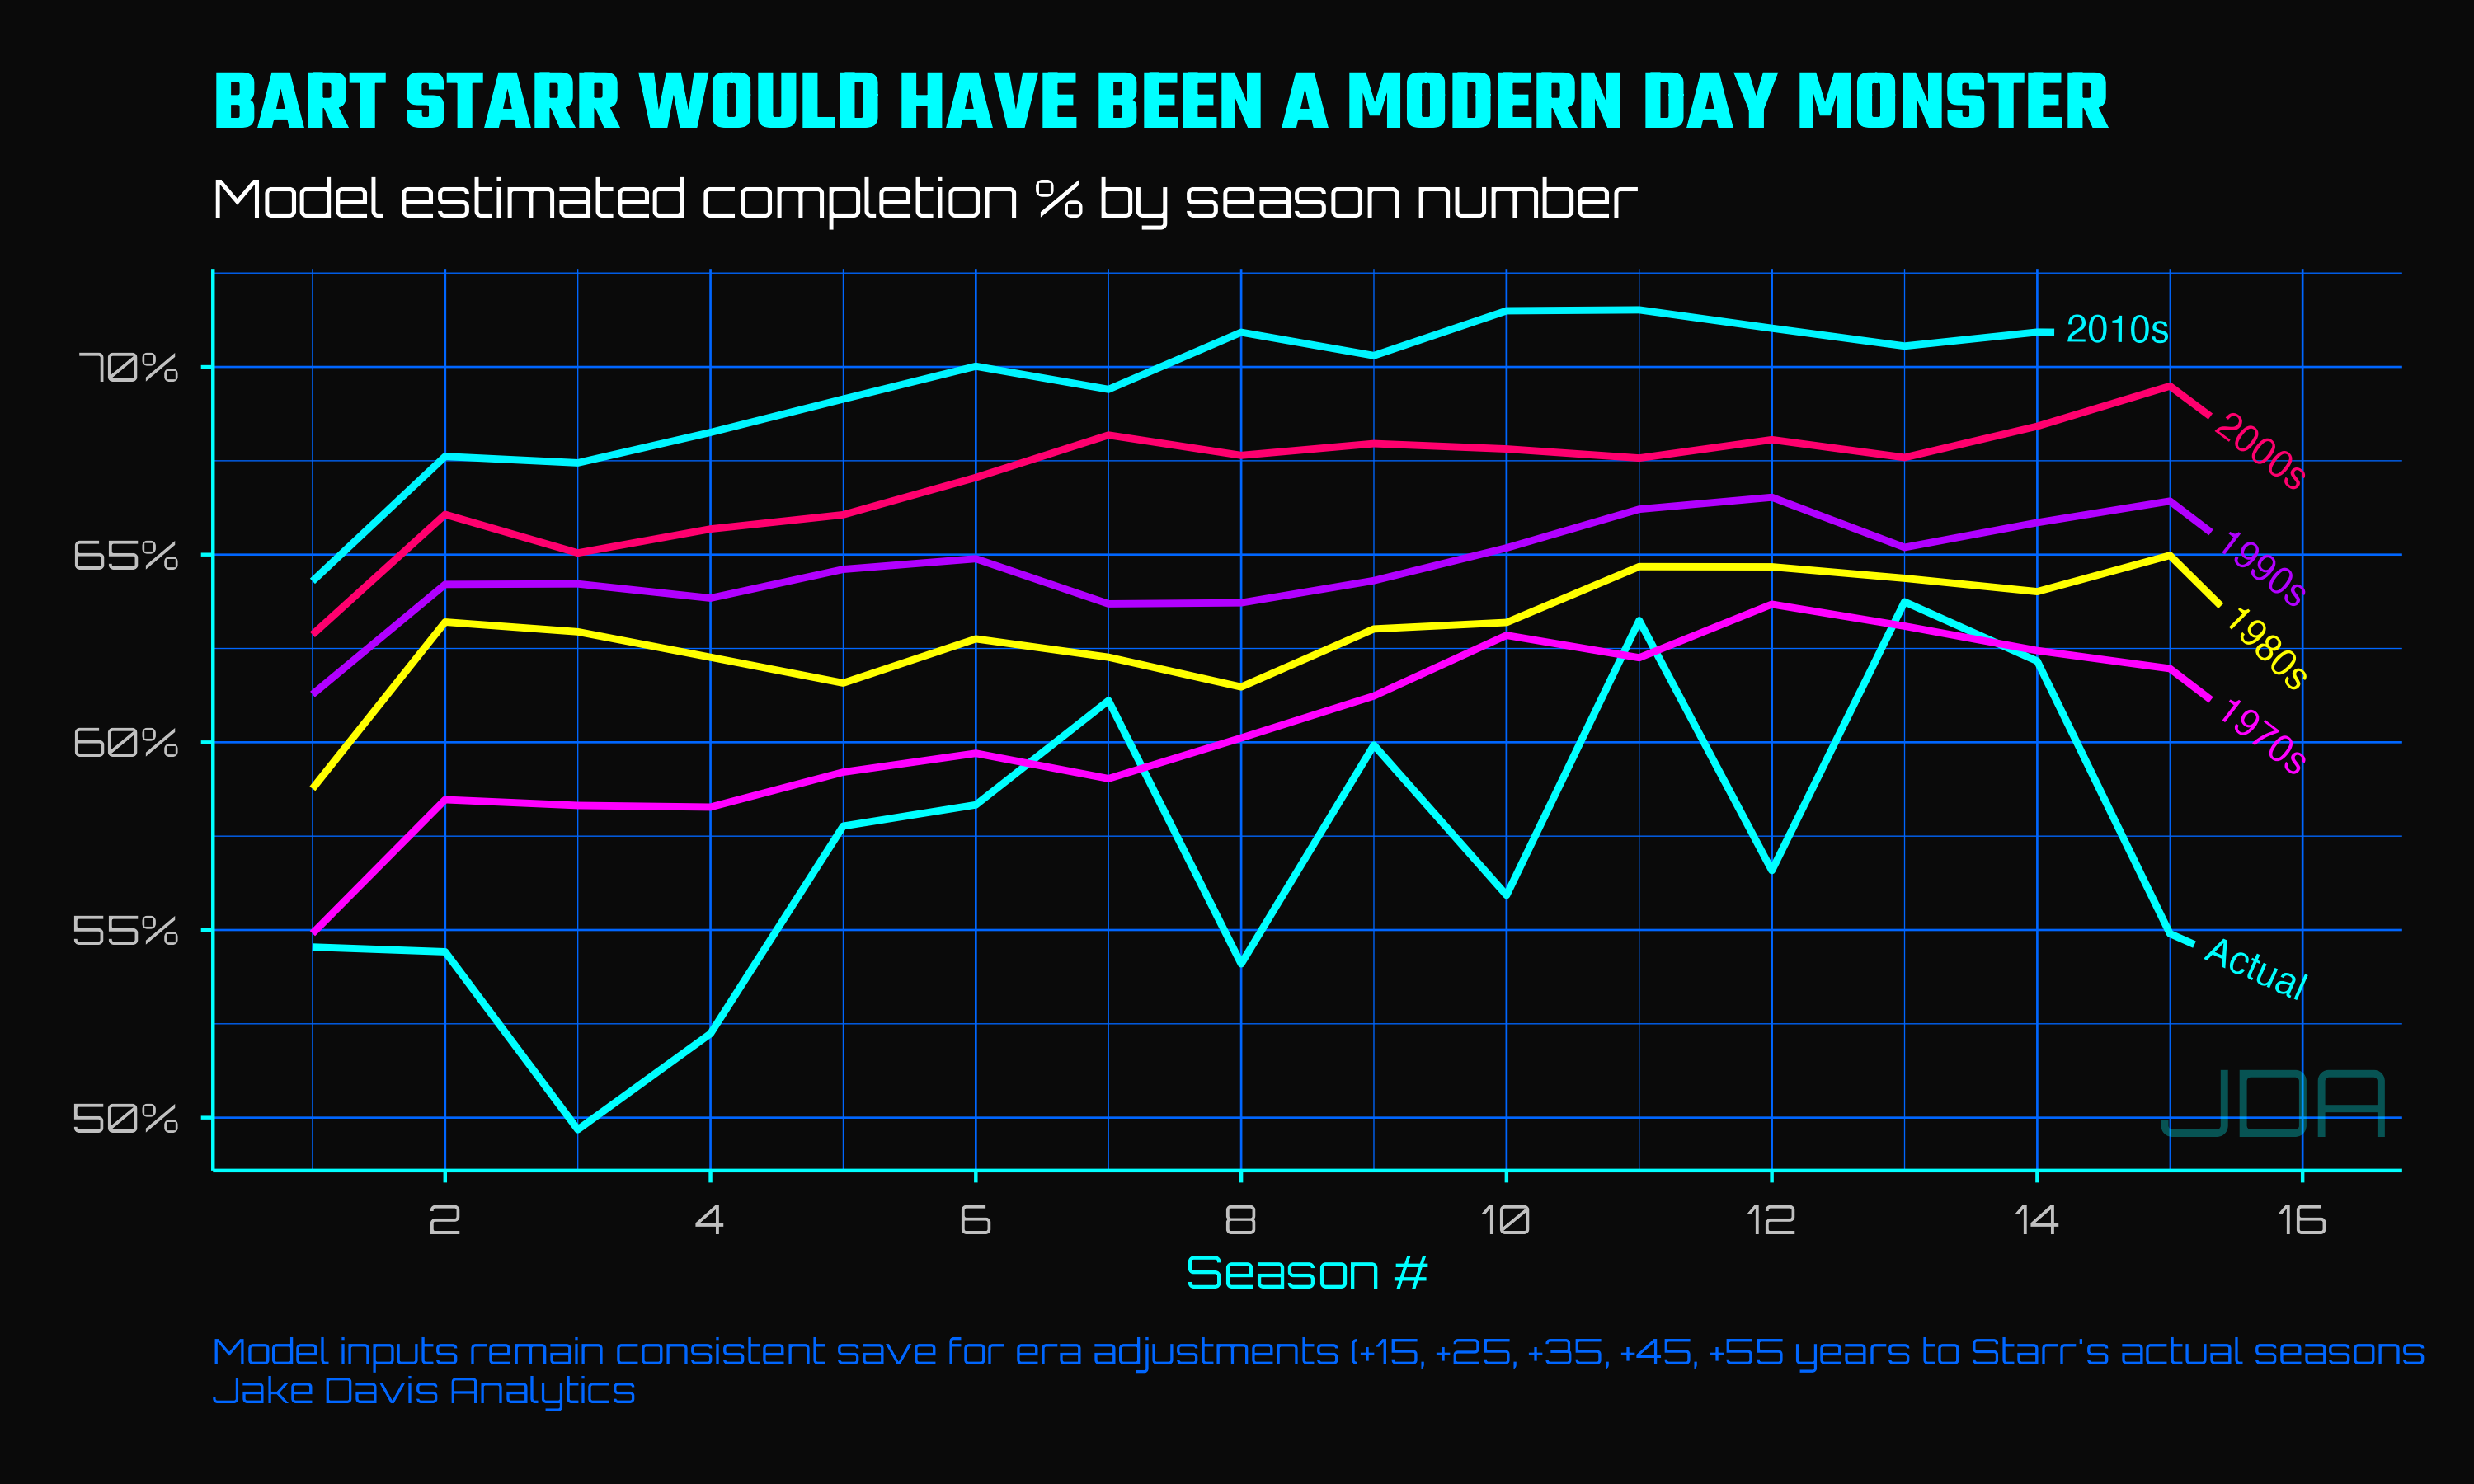
The model tells a store in which Starr’s career completion percentage grows with era adjustments to be one of the best of all time - 61% in the 1970s, 63% in the 80s, 65% in the 90s, 67% in the 2000s, and over 70% in the 2010s. Brees’ career completion percentage through his first 16 years measures at 66.4%.
Is this “true”? Not, not really, since Starr only had one career and counter-factuals are precisely what the name says - counter to fact. But it’s still interesting and fun, and that’s what I’m here for.
The GOAT Completer of Passers still has uncertainty
The final major feature to discuss of any model is its estimate of uncertainty. I touched briefly on this in the shrinkage section, but uncertainty in the world is entropic - it propogates through systems and builts on itse;f. The uncertainty in the shrinkage estimates is around confidence in the point estimate - but it’s not the actual prediction interval, which accounts for uncertainty in the model’s estimates of its components. That’s a bit heavy for this post, so I’ll focus just on the uncertainty around the Isolated Completion Effect, and how that uncertainty allows us to test our conclusion20.
I’ll show this in two ways - first through the top 10 Isolated Completion Effect passers of all time, and then through the top players at each position.
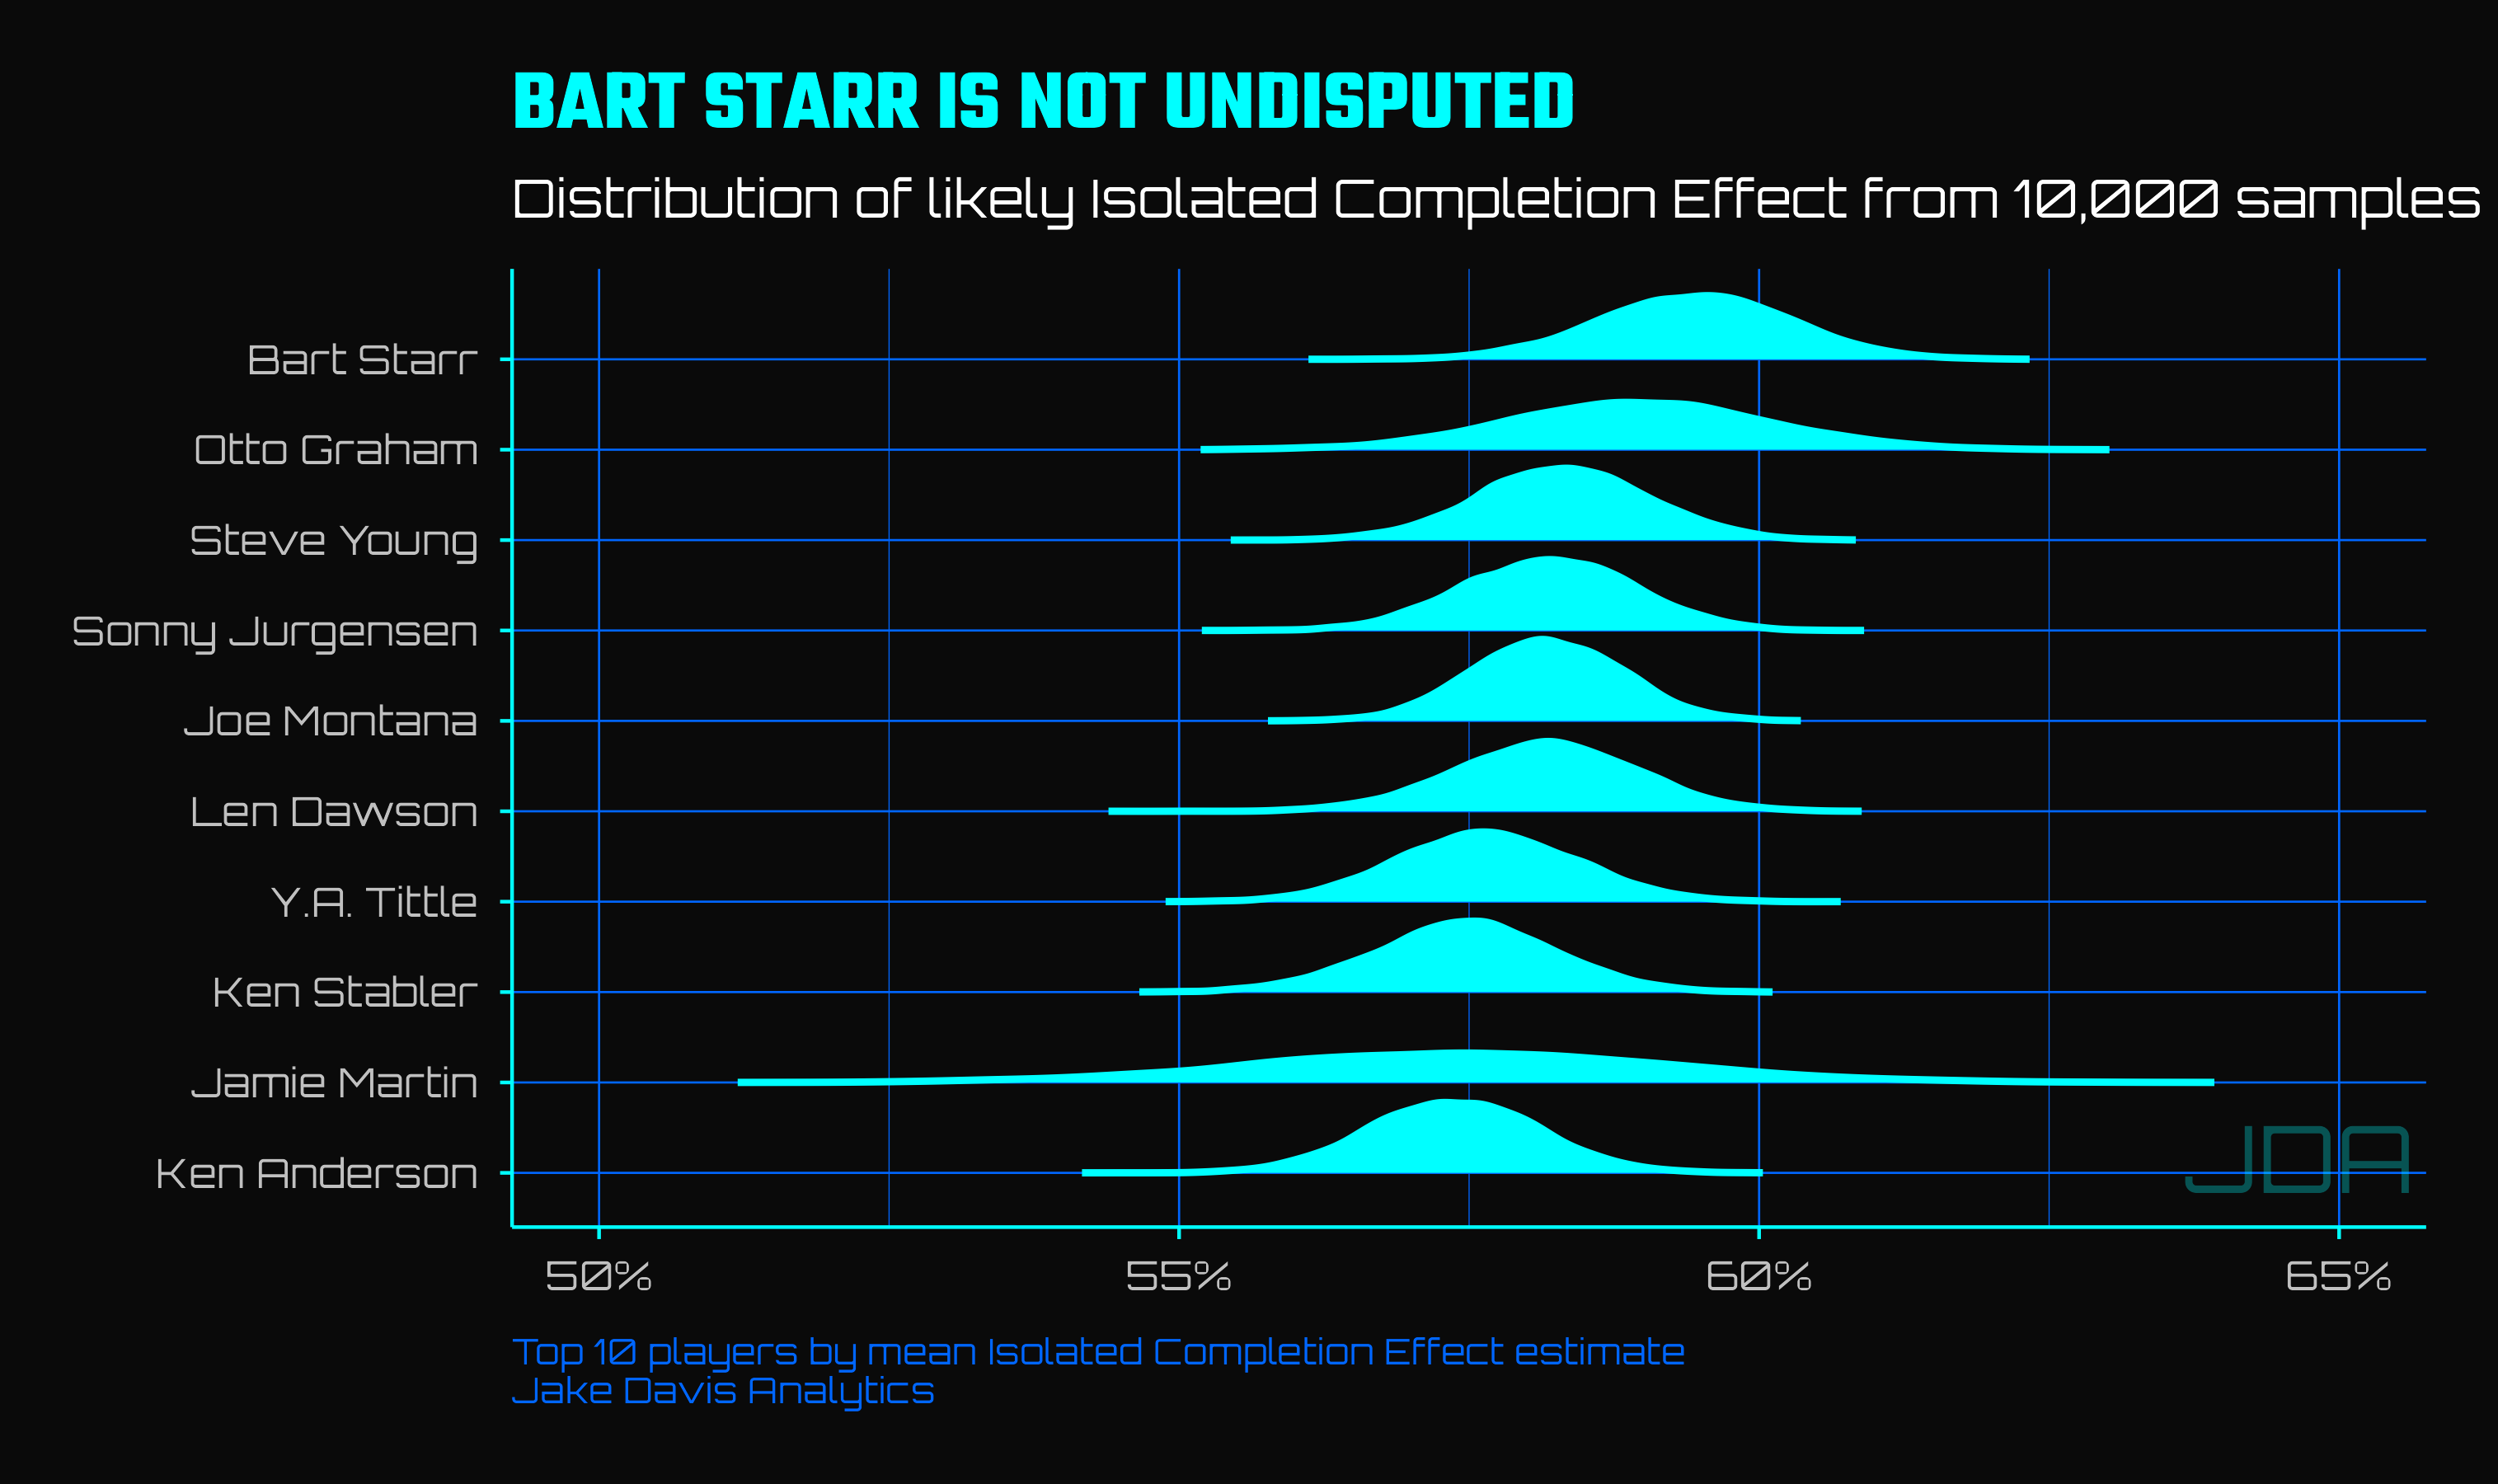
With uncertainty about Isolated Completion Effect included, the top 10 list becomes far more nuanced. Otto Graham’s distribution doesn’t appear markedly different thatn Bart Starr’s, and eight of the nine pasers below Starr have uncertainty intervals higher than Bart’s estimated Isolated Completion Effect. This nuance suggests that, even with the era and evidence controls, it is still tough to be too declarative in drawing conclusions. In fact, this can be tested - there is only a 64% chance that Starr was definitevely better than Graham21. That sounds high…but how much would hypothetical you wager on it?
Or take the case of Jamie Martin, a career backup with only about 540 attempts. The model loves him, but it’s not quite sure he’s actually good: his “true” Isolated Completion Effect may be as low as 50% or as high as 64%. This implies about an 84% chance that Starr was better, but a 16% to Jamie Martin is pretty fascinating!
Lastly in the world of direct comparisons, let’s compare Starr to Brees once more - and in this case, Starr is clearly has the higher Isolated Completion Effect. The model estimates a 99% chance that Starr’s effect is higher than Brees. How? Because Brees accumulated so much evidence regarding Brees, it’s pretty certain that his Isolated Completion Effect is between 55% and 58% - and only a small portion of that distribution exceeds Starr’s distibution, despite their mean estimates being fairly close.
Examining the distributions of the top passers by Isolated Completion Effect by position is also interesting - according to the model Antwaan Randle El is credibly a better completer of passes than Starr22!
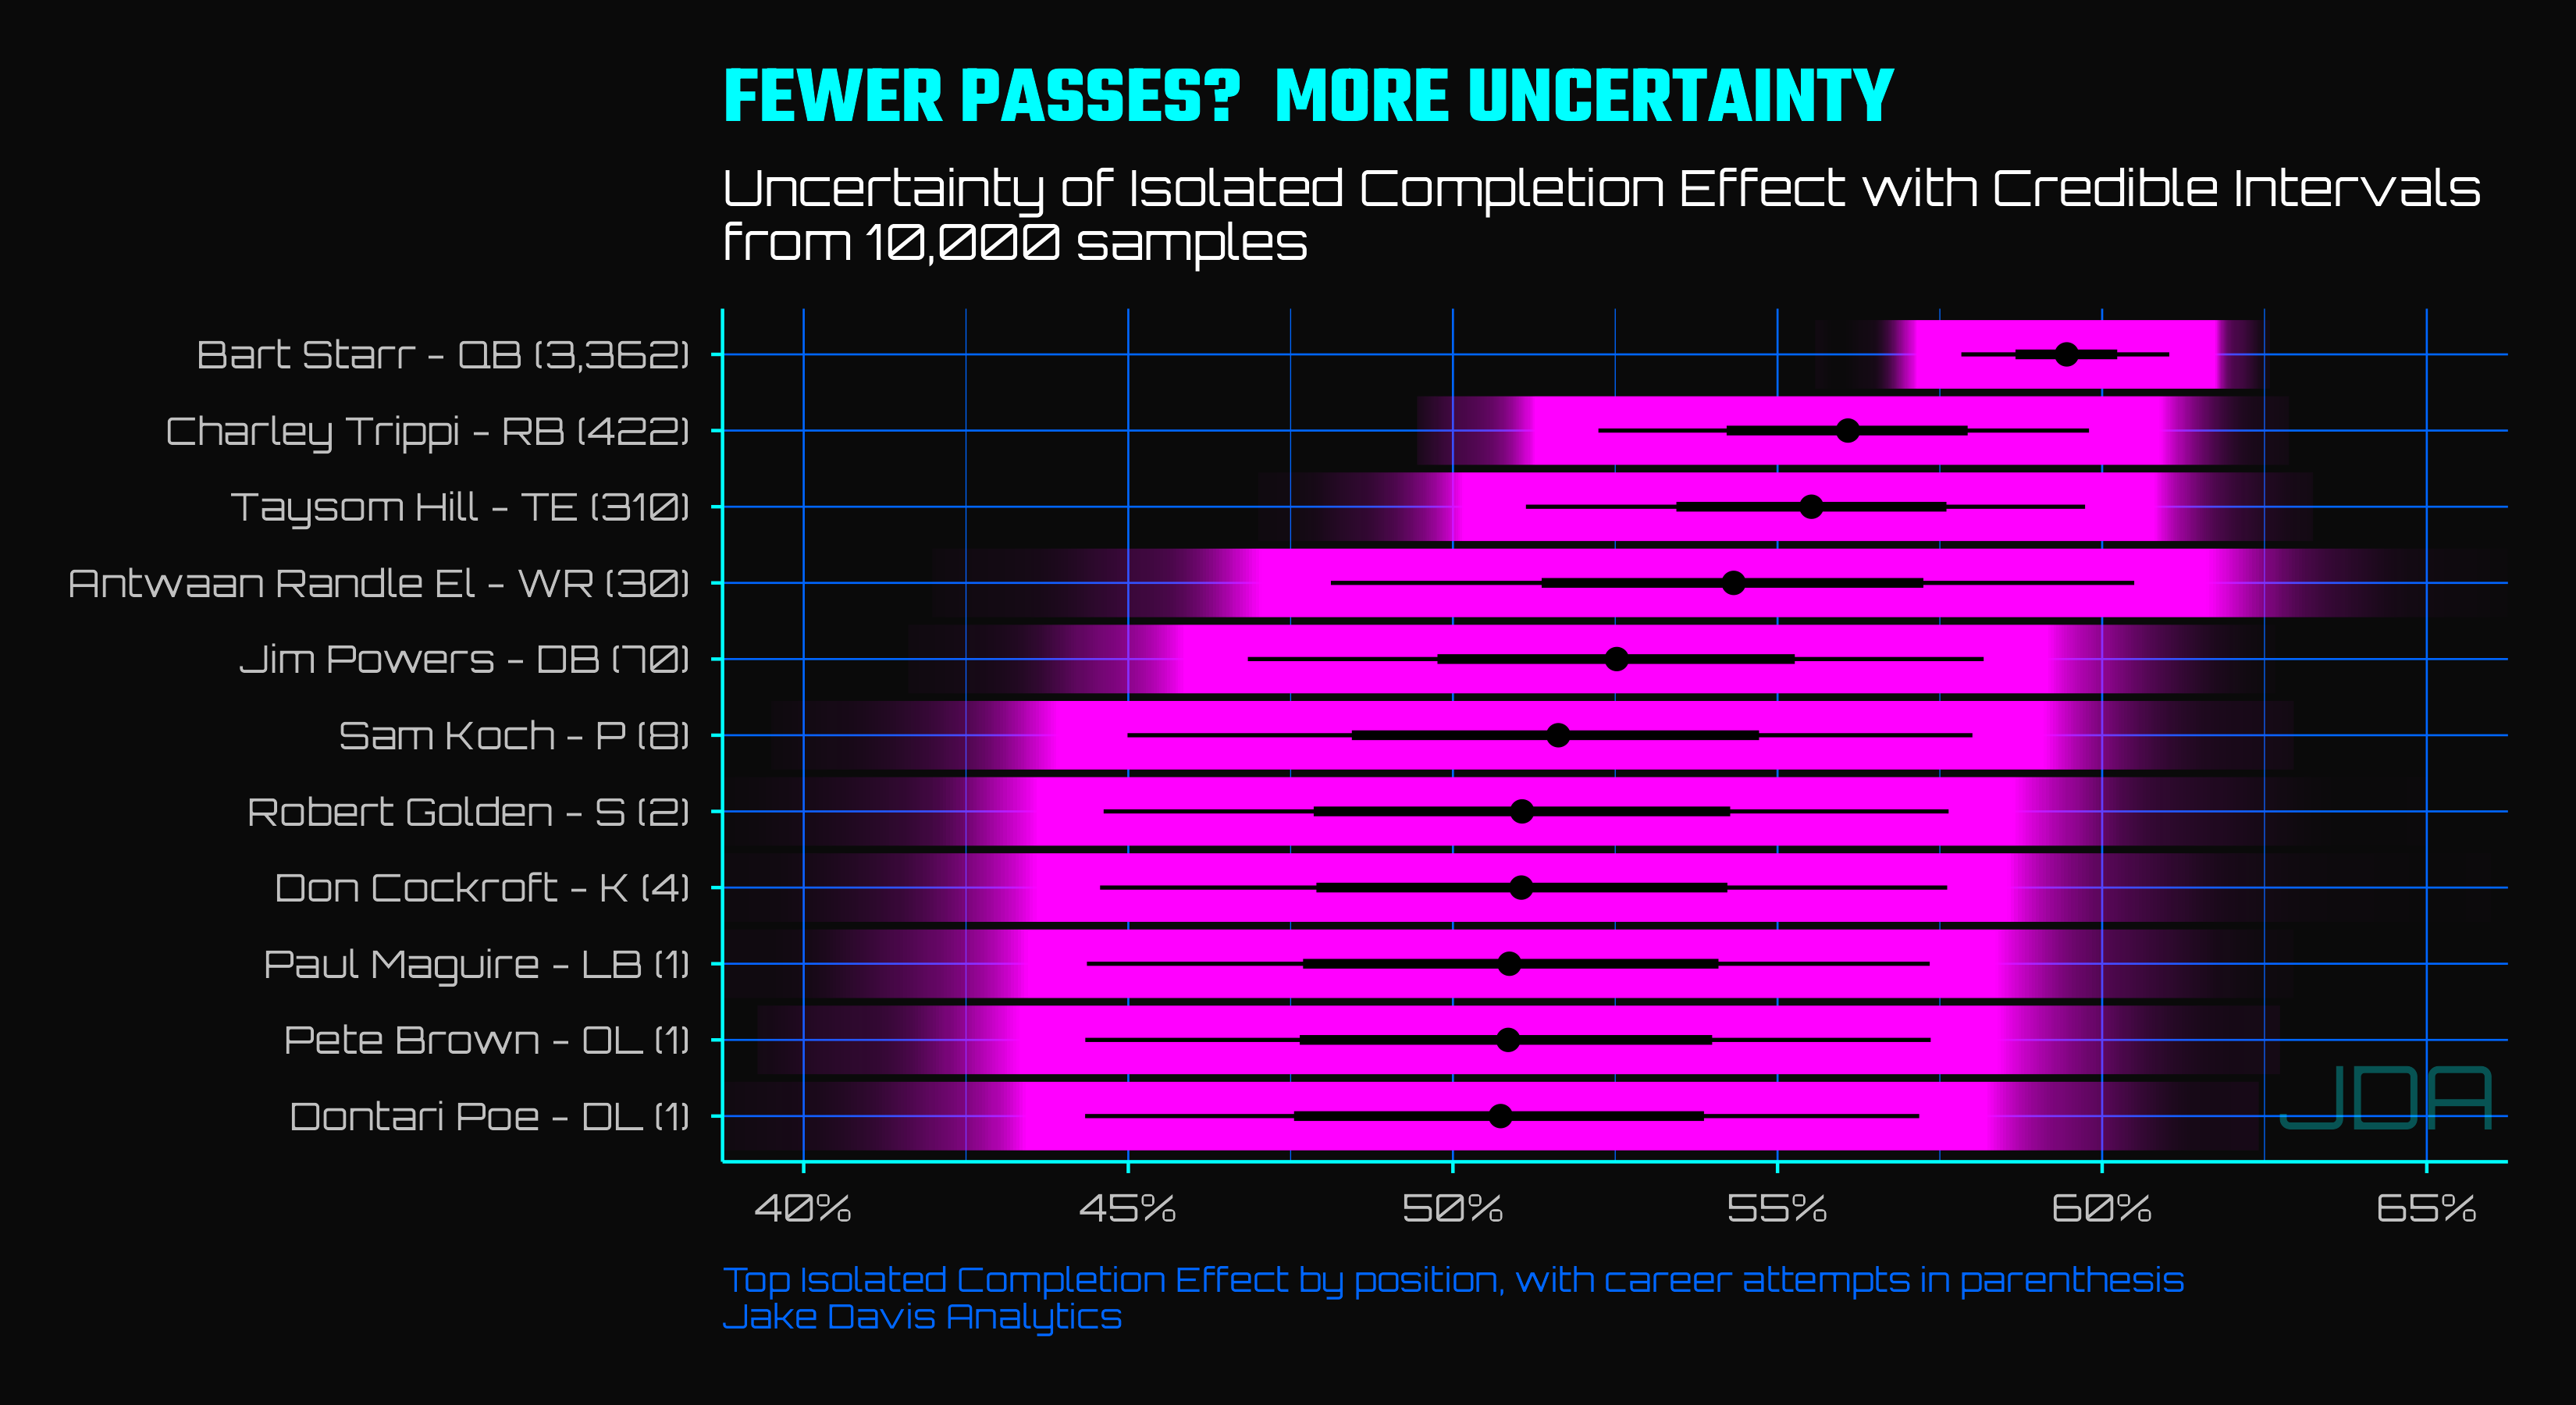
In the cases where the model has only 1 attempt to work from, the Isolated Completion Effect is massively wide - the model has no idea whether to assign the 100% completion percentage to skill, era, or luck. So it throws it’s hands up, estimates a massive distribution, and then picks the center for the estimate. But as attempts go up - shout-out to occasional QB Charley Trippi! - the estimates uncertainty declines. And that’s why I love statistical models!
So there you have it, 3,500 words later. A theoretically simple analysis that was actually very complex, answered through a statistical model. Congrats to Starr, our GOAT completer of passes, but credit where credit is due - Jauan Jennings with a 51% Isolated Completion Effect, good for 77% percentile in the database. I hope this lengthy analysis illustrated the power behind statistical modeling and the tools that models provide “for free” beyond the analysis itself. And hopefully this analysis illustrates how what often seems like simple questions can be deeply complex, if you take the time to think about them.
Thanks for taking the time,
-Jake
Artifacts
Isolated Completion Effect database
You’re not right, hypothetical you.
Or one of it’s legacy leagues like the AFL
Obviously, because you don’t exist outside of my head.
It does, if we’re being very literal about “completion percentage” indicating the metric of success, and attempts being the tie-breaker metric, but this is kinda dumb.
At least, it’s mildly positive, with r = .16. It jumps to .32 when the 1,500 attempts filter is applied.
We are not choosing that window.
completion% = b0 + b1 x season = +0.00236 completion percentage per year, or a standardized slope of 0.98.
23 attempts per game in 2025 vs 14 in 1950 (up 58%).
10.9 yards per completion in 2025 vs 14.3 in 1950 (down 24%).
And many others - including better fitting equipment, better wide receivers, better coaching, et cetera, et cetera.
The coefficient of variation represents the percentage distance from the mean a standard deviation represents. It’s calculated as the sd/mean. To illustrate it’s usefulness, take completion percentages in 1970 vs 2005 - both seasons CP had a standard deviation of roughly .0522, but in 1970 the leage average CP was 51.4% vs 59.9% in 2005. The coefficient of variations were therefore 10.1% and 8.7%, respectively. Same standard deviations, but the relative spreads are different.
Specifically, completions are modeled as binomial with a logit link:
logit(pᵢ) = β₀ + β₁·trendᵢ + β₂·remainderᵢ + β₃·log attemptsᵢ + γₚₒₛ₍ᵢ₎ + uⱼ
uⱼ ~ Normal(0, σ²ₚₗₐᵧₑᵣ)
Fixed effects include era trend and annual deviations (from STL decomposition of league-wide completion percentage on the logit scale), centered log attempts, and position. Player identity enters as a random intercept.
The isolated completion effect is p̂ⱼ = logistic(β̂₀ + ûⱼ) - the predicted completion probability in a neutral environment: average era, typical season, median volume, median yards per completion, QB position.
In statistics parlance, this is called a BLUP - best linear unbiased predictor - which is the model’s best guess at each player’s inherent statistical effect, which can be treaded as his “skill”.
Or, at least, statistically equal footing
Top 10 in 14 of 16 seasons
6% higher completion percentage in the playoffs vs his career regular season average
Model specification would potentially benefit for expected difficulty of the throw - like air yards, coverage tightness, ESPN’s expected completion model, or other variables such as defense or receiver. But also this is a fun substack post, so you get what you get and you don’t get upset.
The model has a fairly low r-squared and RMSE, (14.5 and 26%, respectively), but that’s sort of the point - I’m including a ton of players with just a few attempts in the heirarchy, and the bayesian shrinkage is kind of motivating element of this entire analysis. Maybe one day, I’ll write about how model metrics often are useless in the frame of the actual question at hand. Who knows? In either case, the metrics get much better when measuring on filtered predictions for more attempts - when estimated on seasons with 100 attempts or more, the metrics dramatically improve (74.5 r-squared and 3.4% RMSE - these are not out-of-sample, as that prohibits the estimate of the random effects I care about).
Minimum 1,500 career attempts
Through hypothesis testing
About a 5% chance.
Jake, enjoyed reading this article. Keep them coming!