


“Were the Seattle Seahawks the best team in football last season?”
A simple question, and one that you might answer simply: Yes - they won the Super Bowl!1
But how certain are you in that answer? After all, plenty of teams that win the Super Bowl don’t have the best record.2 In fact, the team with the best record has only won the Super Bowl 6 times out of the last 16 seasons…so what gives?
Beyond the fact that the goal of (most) NFL teams is not to have the best record but to win the Super Bowl, the 38% conversion rate from best record to SB winner highlights one of the most distinctive features of American Football - small sample sizes.
The NFL is unique in that teams play only 17 games, which might seem like a lot to a rabid fan, but it’s a statistically small sample. How confident can you be in that a theoretical 10-7 team truly represents a 59% winning percentage?
Not very! All samples, regardless of size, are subject to noise. A team's "true" win percentage3 isn't directly observable. What’s observed is a record, and a record is one presentation of an underlying process that would look at least a little different if you could rerun the season. The gap between what you saw and what's true is exactly what statistical analysis exists to quantify.
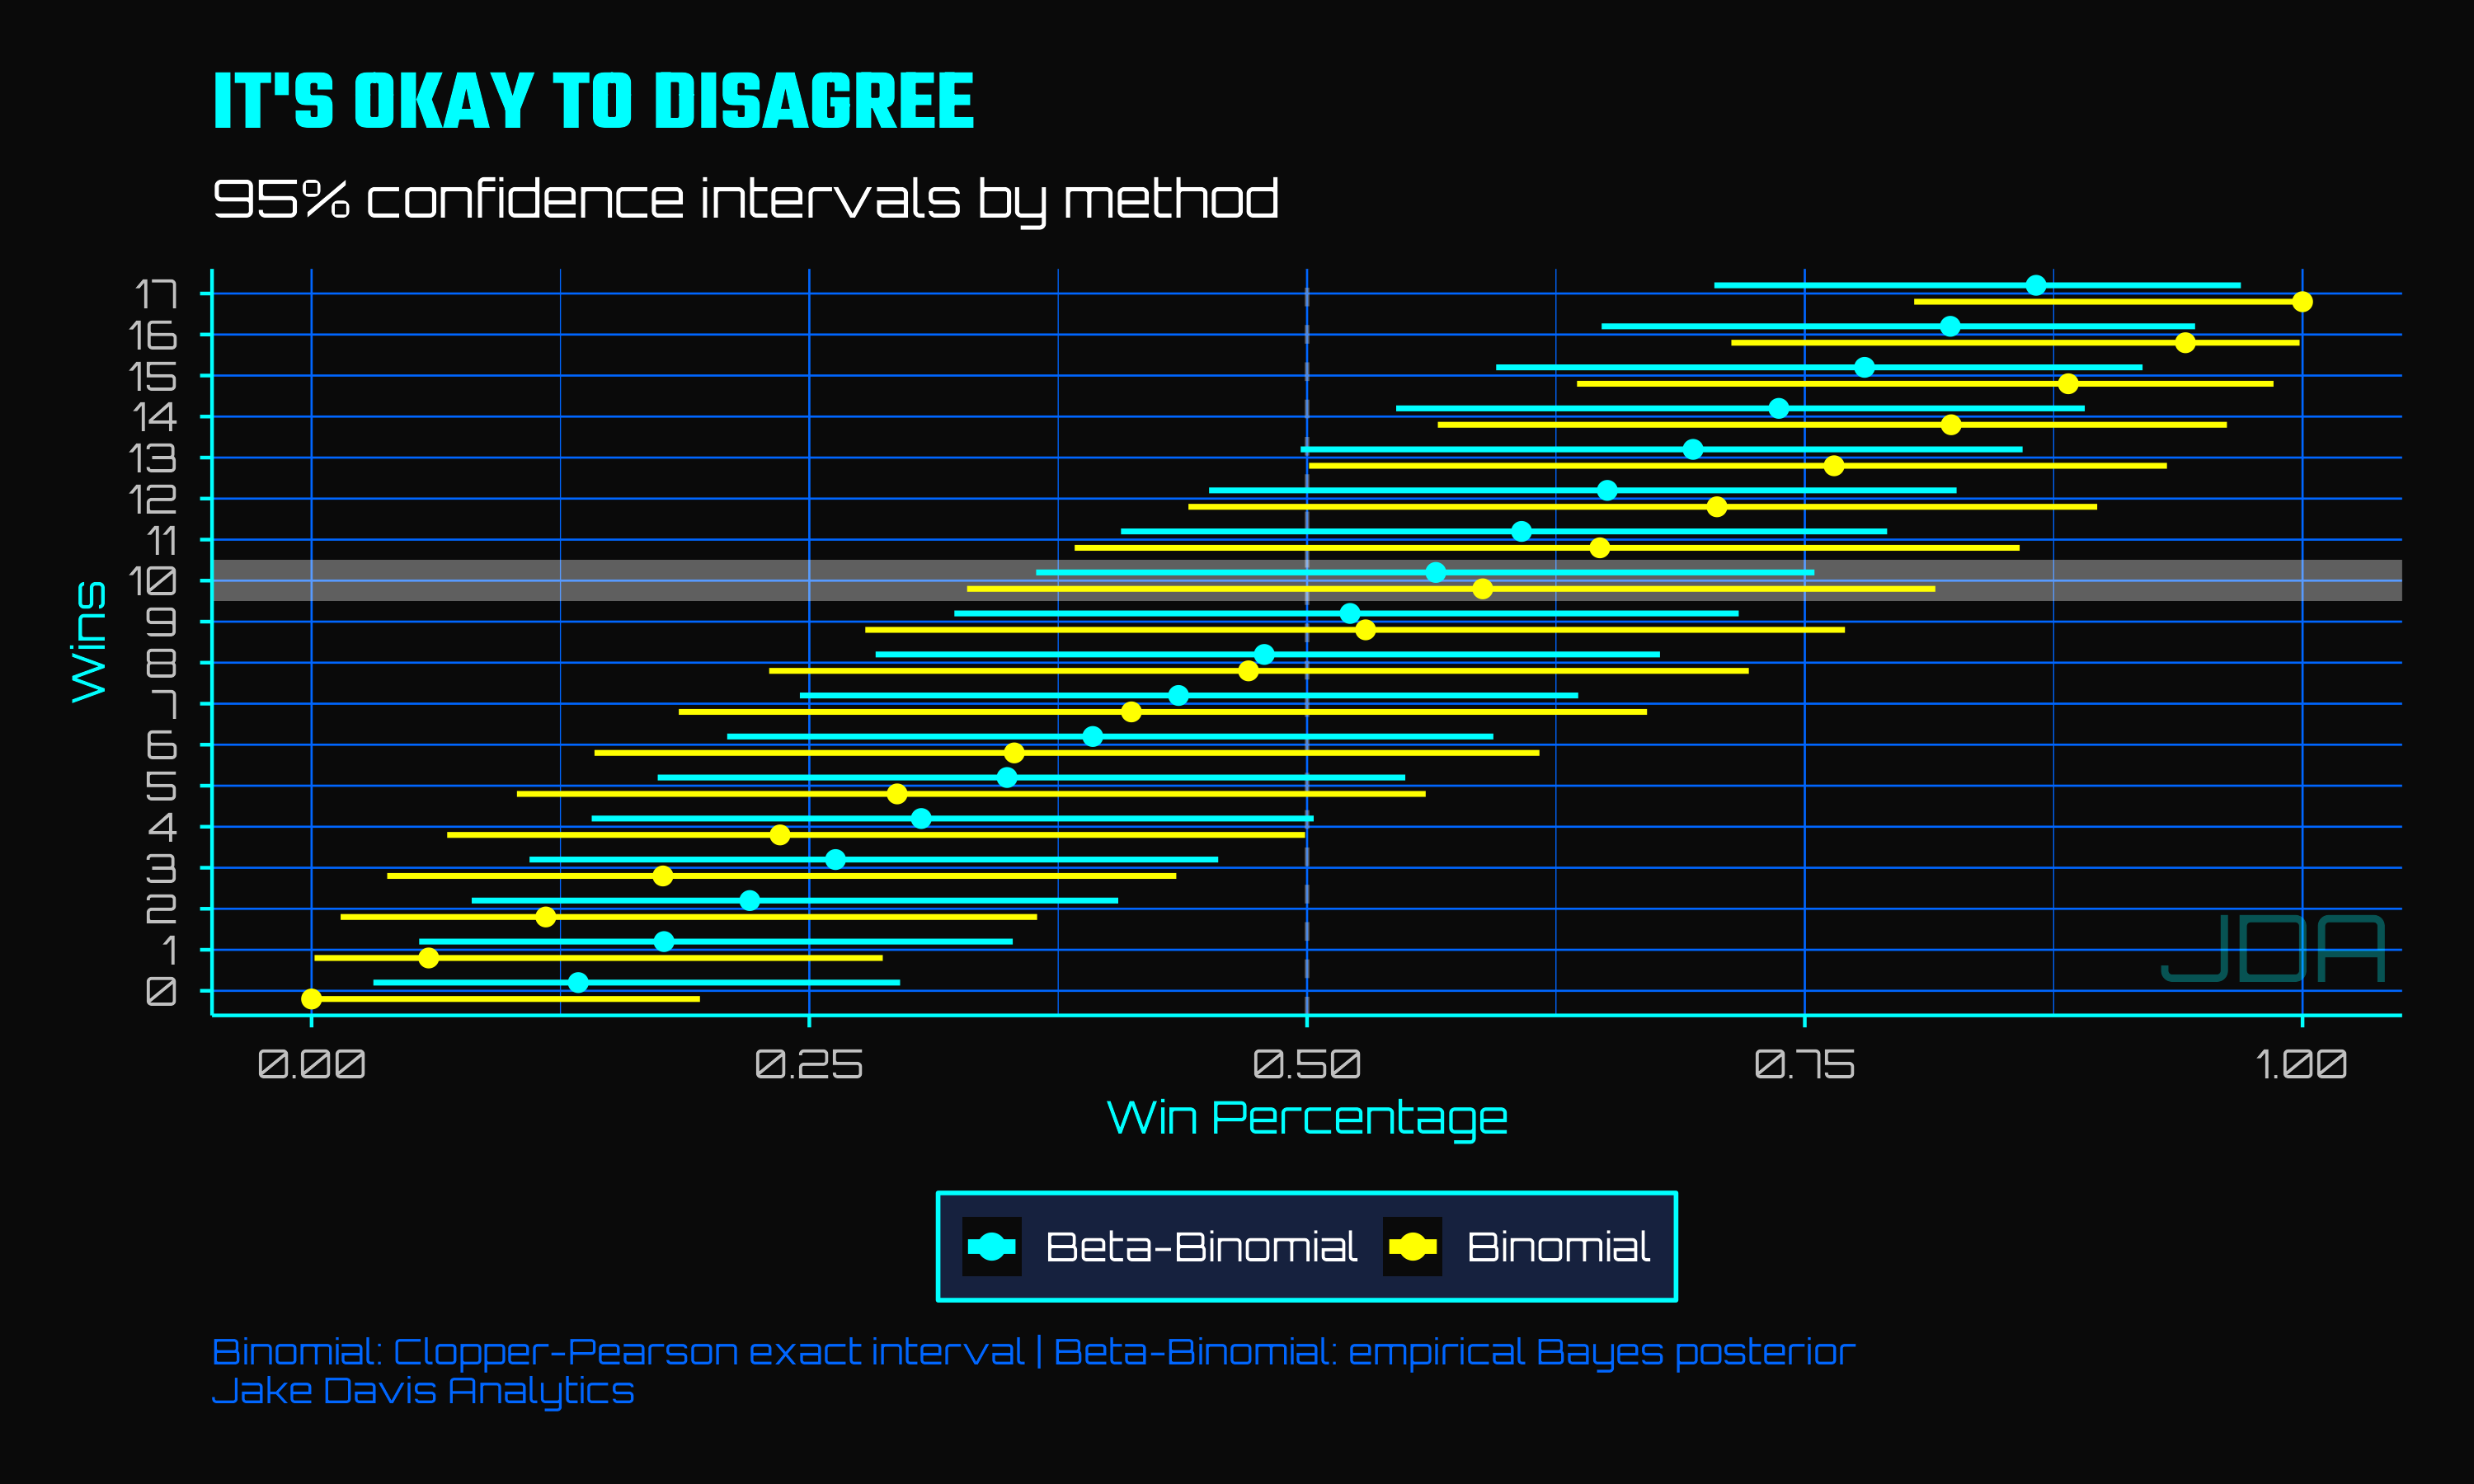
The simplest way to put a number on that gap is the binomial test. If each game is treated as an independent “trial” with some fixed but unknown probability of winning, then asking "what's the true win rate behind a 10-7 record?" is equivalent to asking "what set of underlying probabilities would make 10 wins in 17 tries a realistic outcome?" That's a question that can be answered mathematically - a 95% confidence interval derived from the binomial test will range from roughly 33% to 82%4. That's not a typo! The same 17-game record that looks like a 59% winning team is, statistically, consistent with a team that wins 5-6 games…or one that wins 13-14. The NFL's small sample problem, quantified.
But, wait, you say5, the games aren’t exactly independent. Besides, you have seen lots of NFL seasons before - the binomial test’s flaw is that it doesn’t know that a 5 win season and a 14 win season have some prior probability that can be estimated, just by looking at the distribution of winning percentage across the NFL
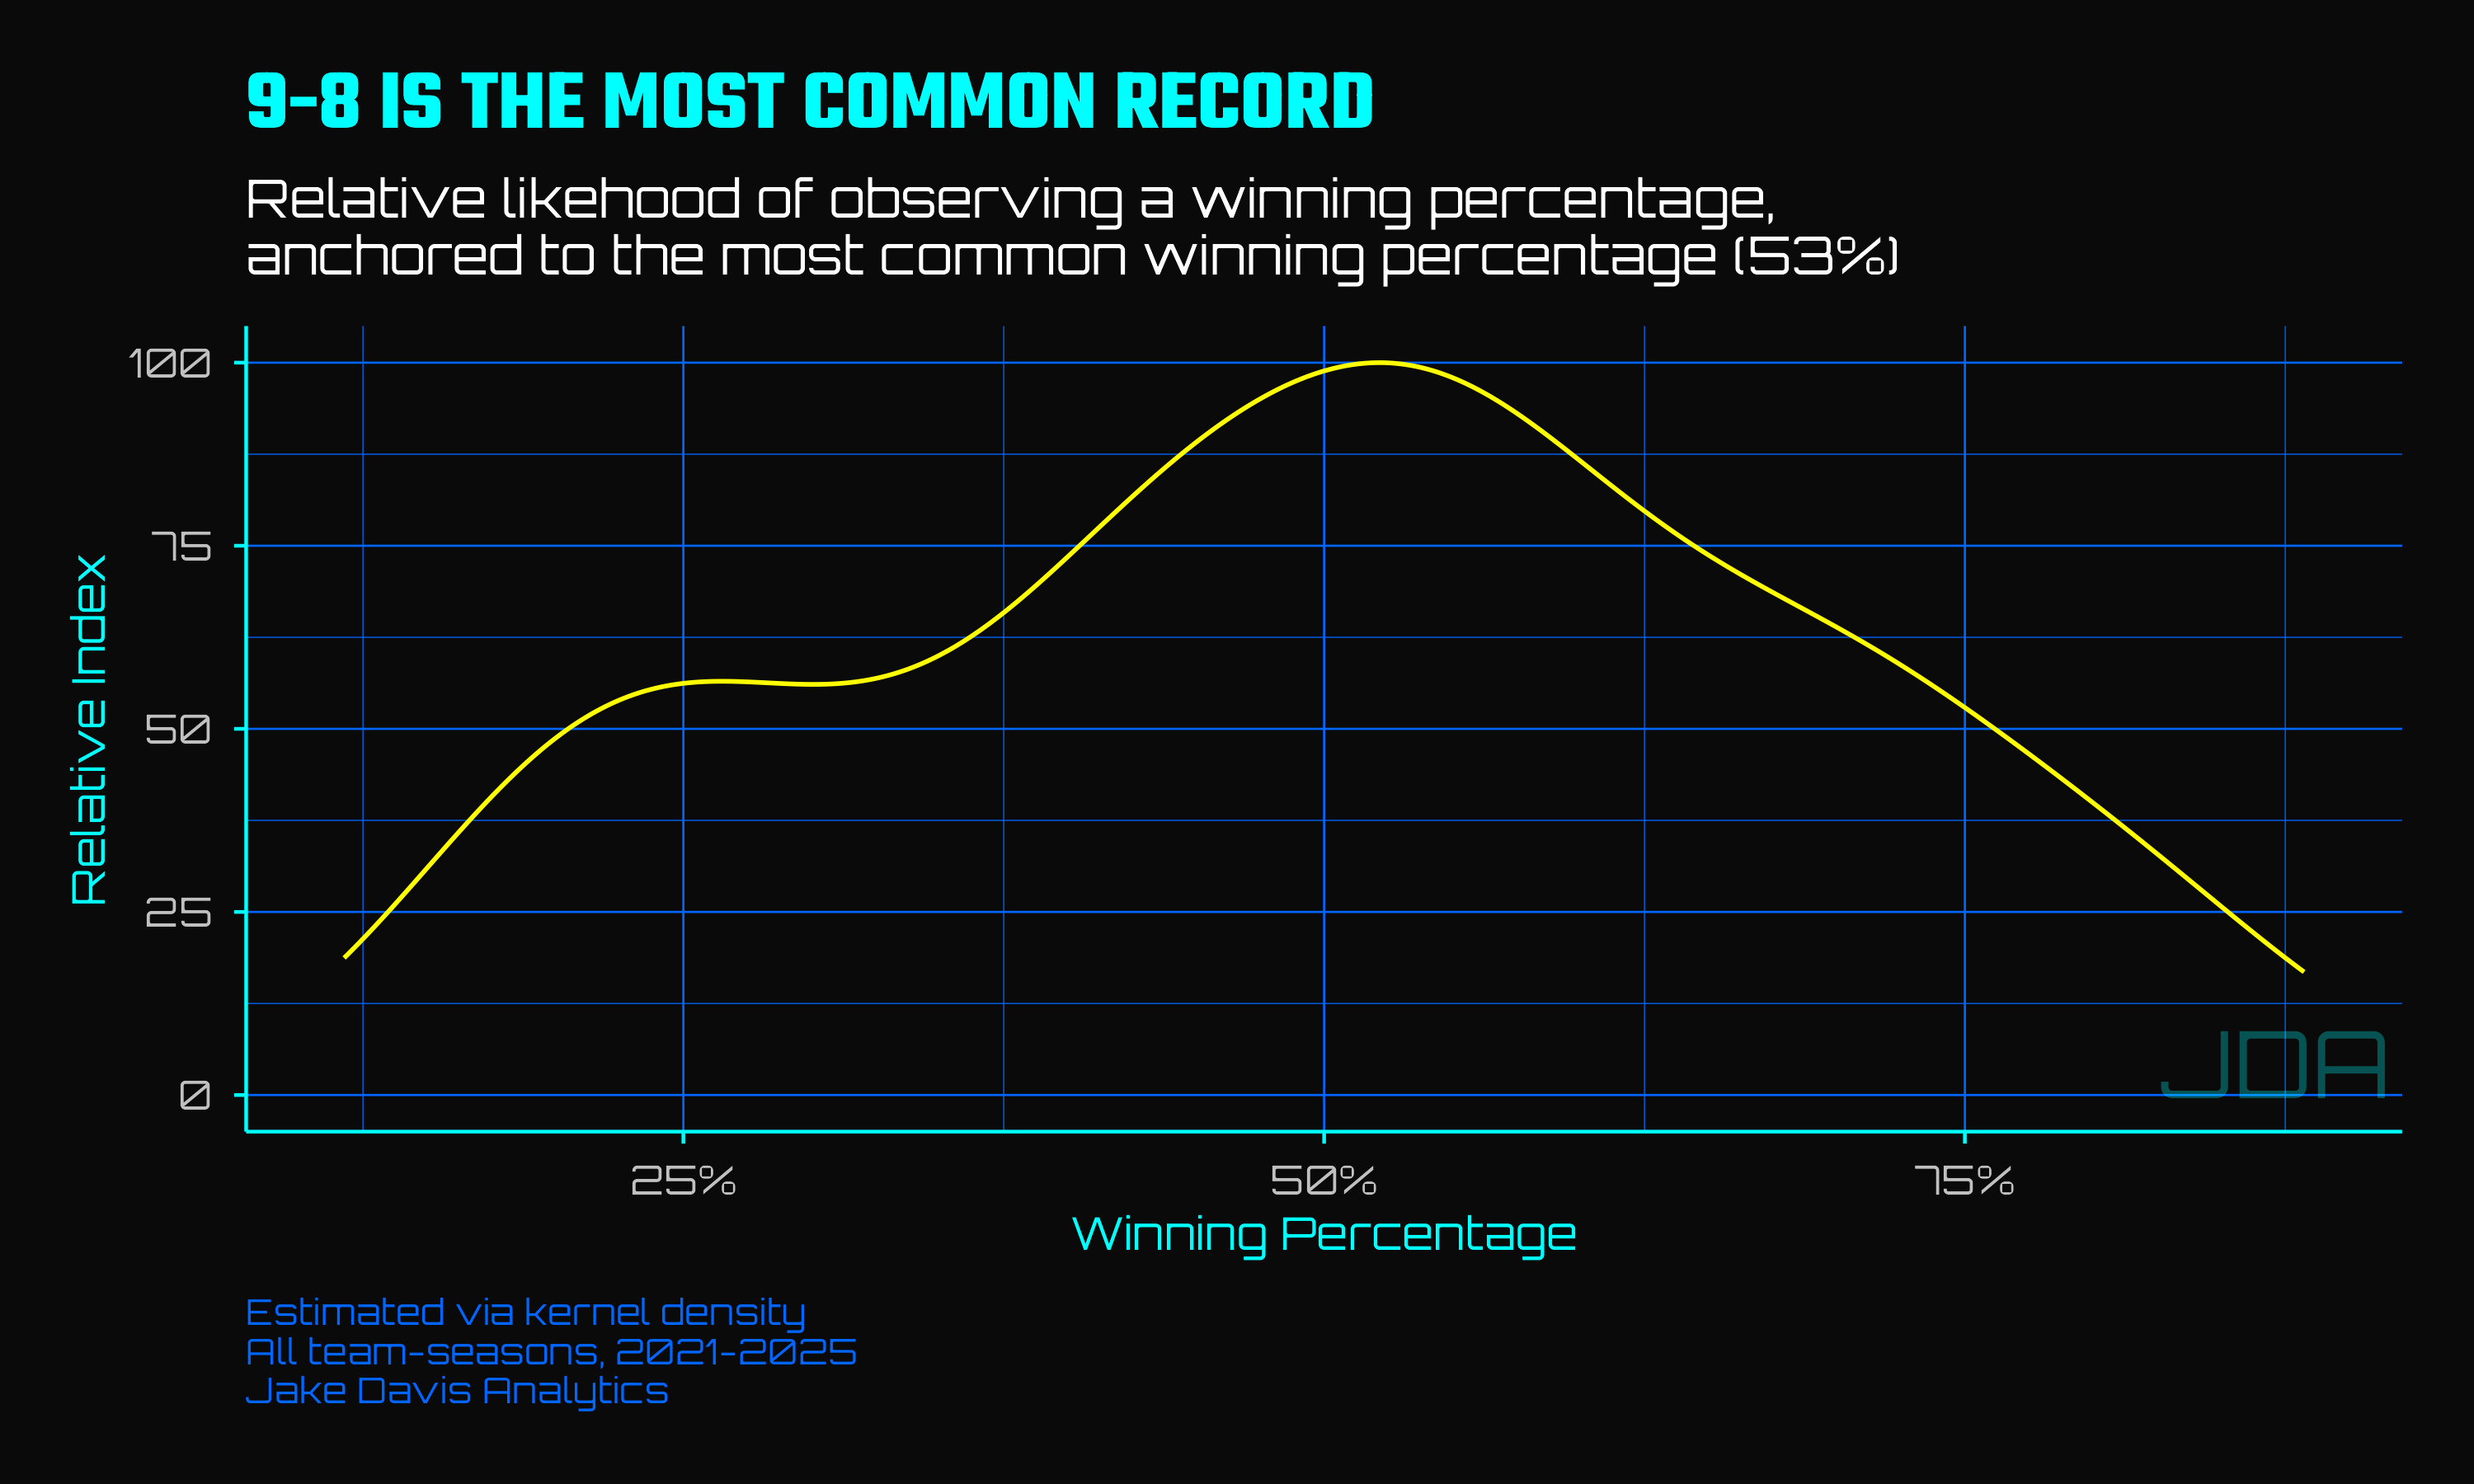
Why throw out that knowledge? You don’t need to - that's the job of the Beta-Binomial model. You have the same 17 games, the same 10 wins, but now the historical distribution of NFL win percentages acts as a prior6, guiding the uncertainty estimate back to reality, and tightening the confidence intervals to something more realistic - in this case, 37% and 75%, or a 6-11 to 12-13 win team. Not a huge difference, but it’s getting closer to truth. This is how each method looks across each possible record78
But statistical models are maybe too…theoretical. What about a different example? One drawn from sports with far more information - in fact, where teams play dozens of “NFL seasons” per year.
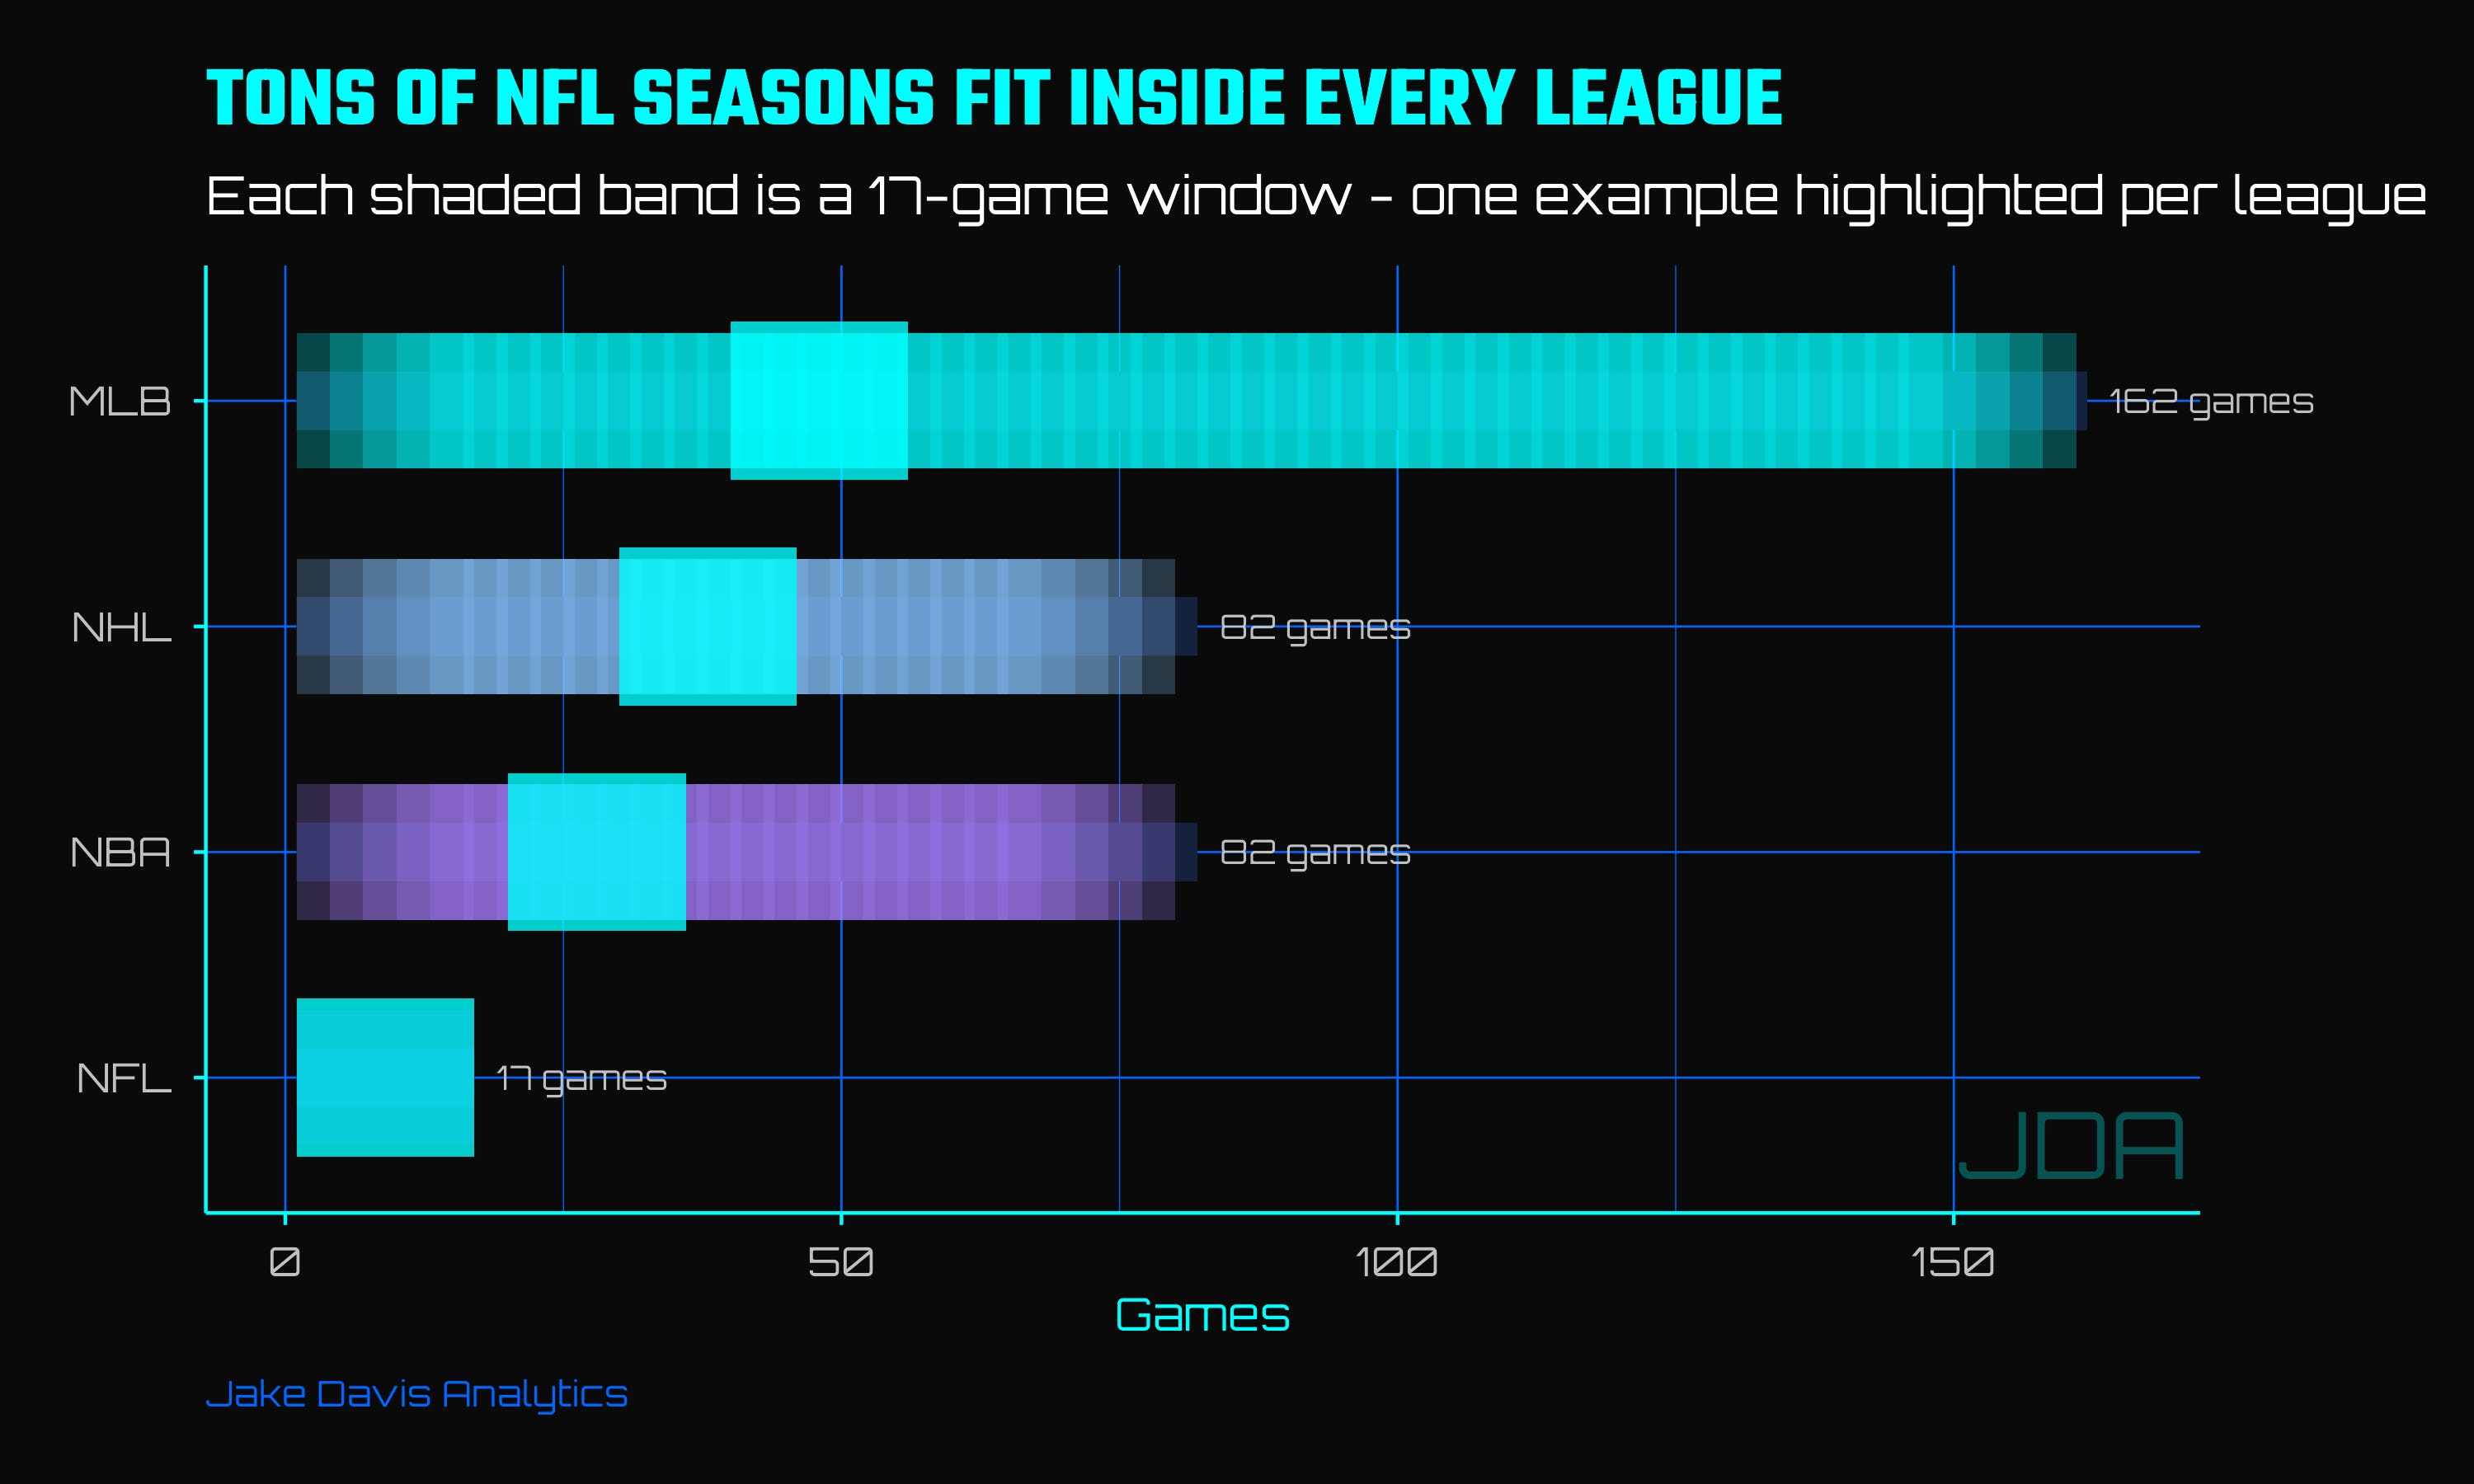
The MLB plays 162 games per year, the NBA and NHL each play 82. Therefore, each team in each league plays a series of NFL length seasons - 17 consecutive game stretches that overlap. Games 1-17, 2-18, 3-19 and so forth,9 and ah screw it, HIT ME WITH THE VISUALIZATION!
Sorry, got excited there, back to the narrative10
Each of these seasons - let’s call them “NFL slices” - contains information that might help illuminate just how informative - or uninformative - a single NFL season is as it pertains to what a good record actually represents, all without resorting to complicated mathematics or statistics. For example, we can look at how each league winner’s best, worst, and average NFL slice looked, or how a Beta-Binomial model fit with another league’s NFL slices changes uncertainty.
But first, let’s start with the basics - how are wins typically distributed across these slices?
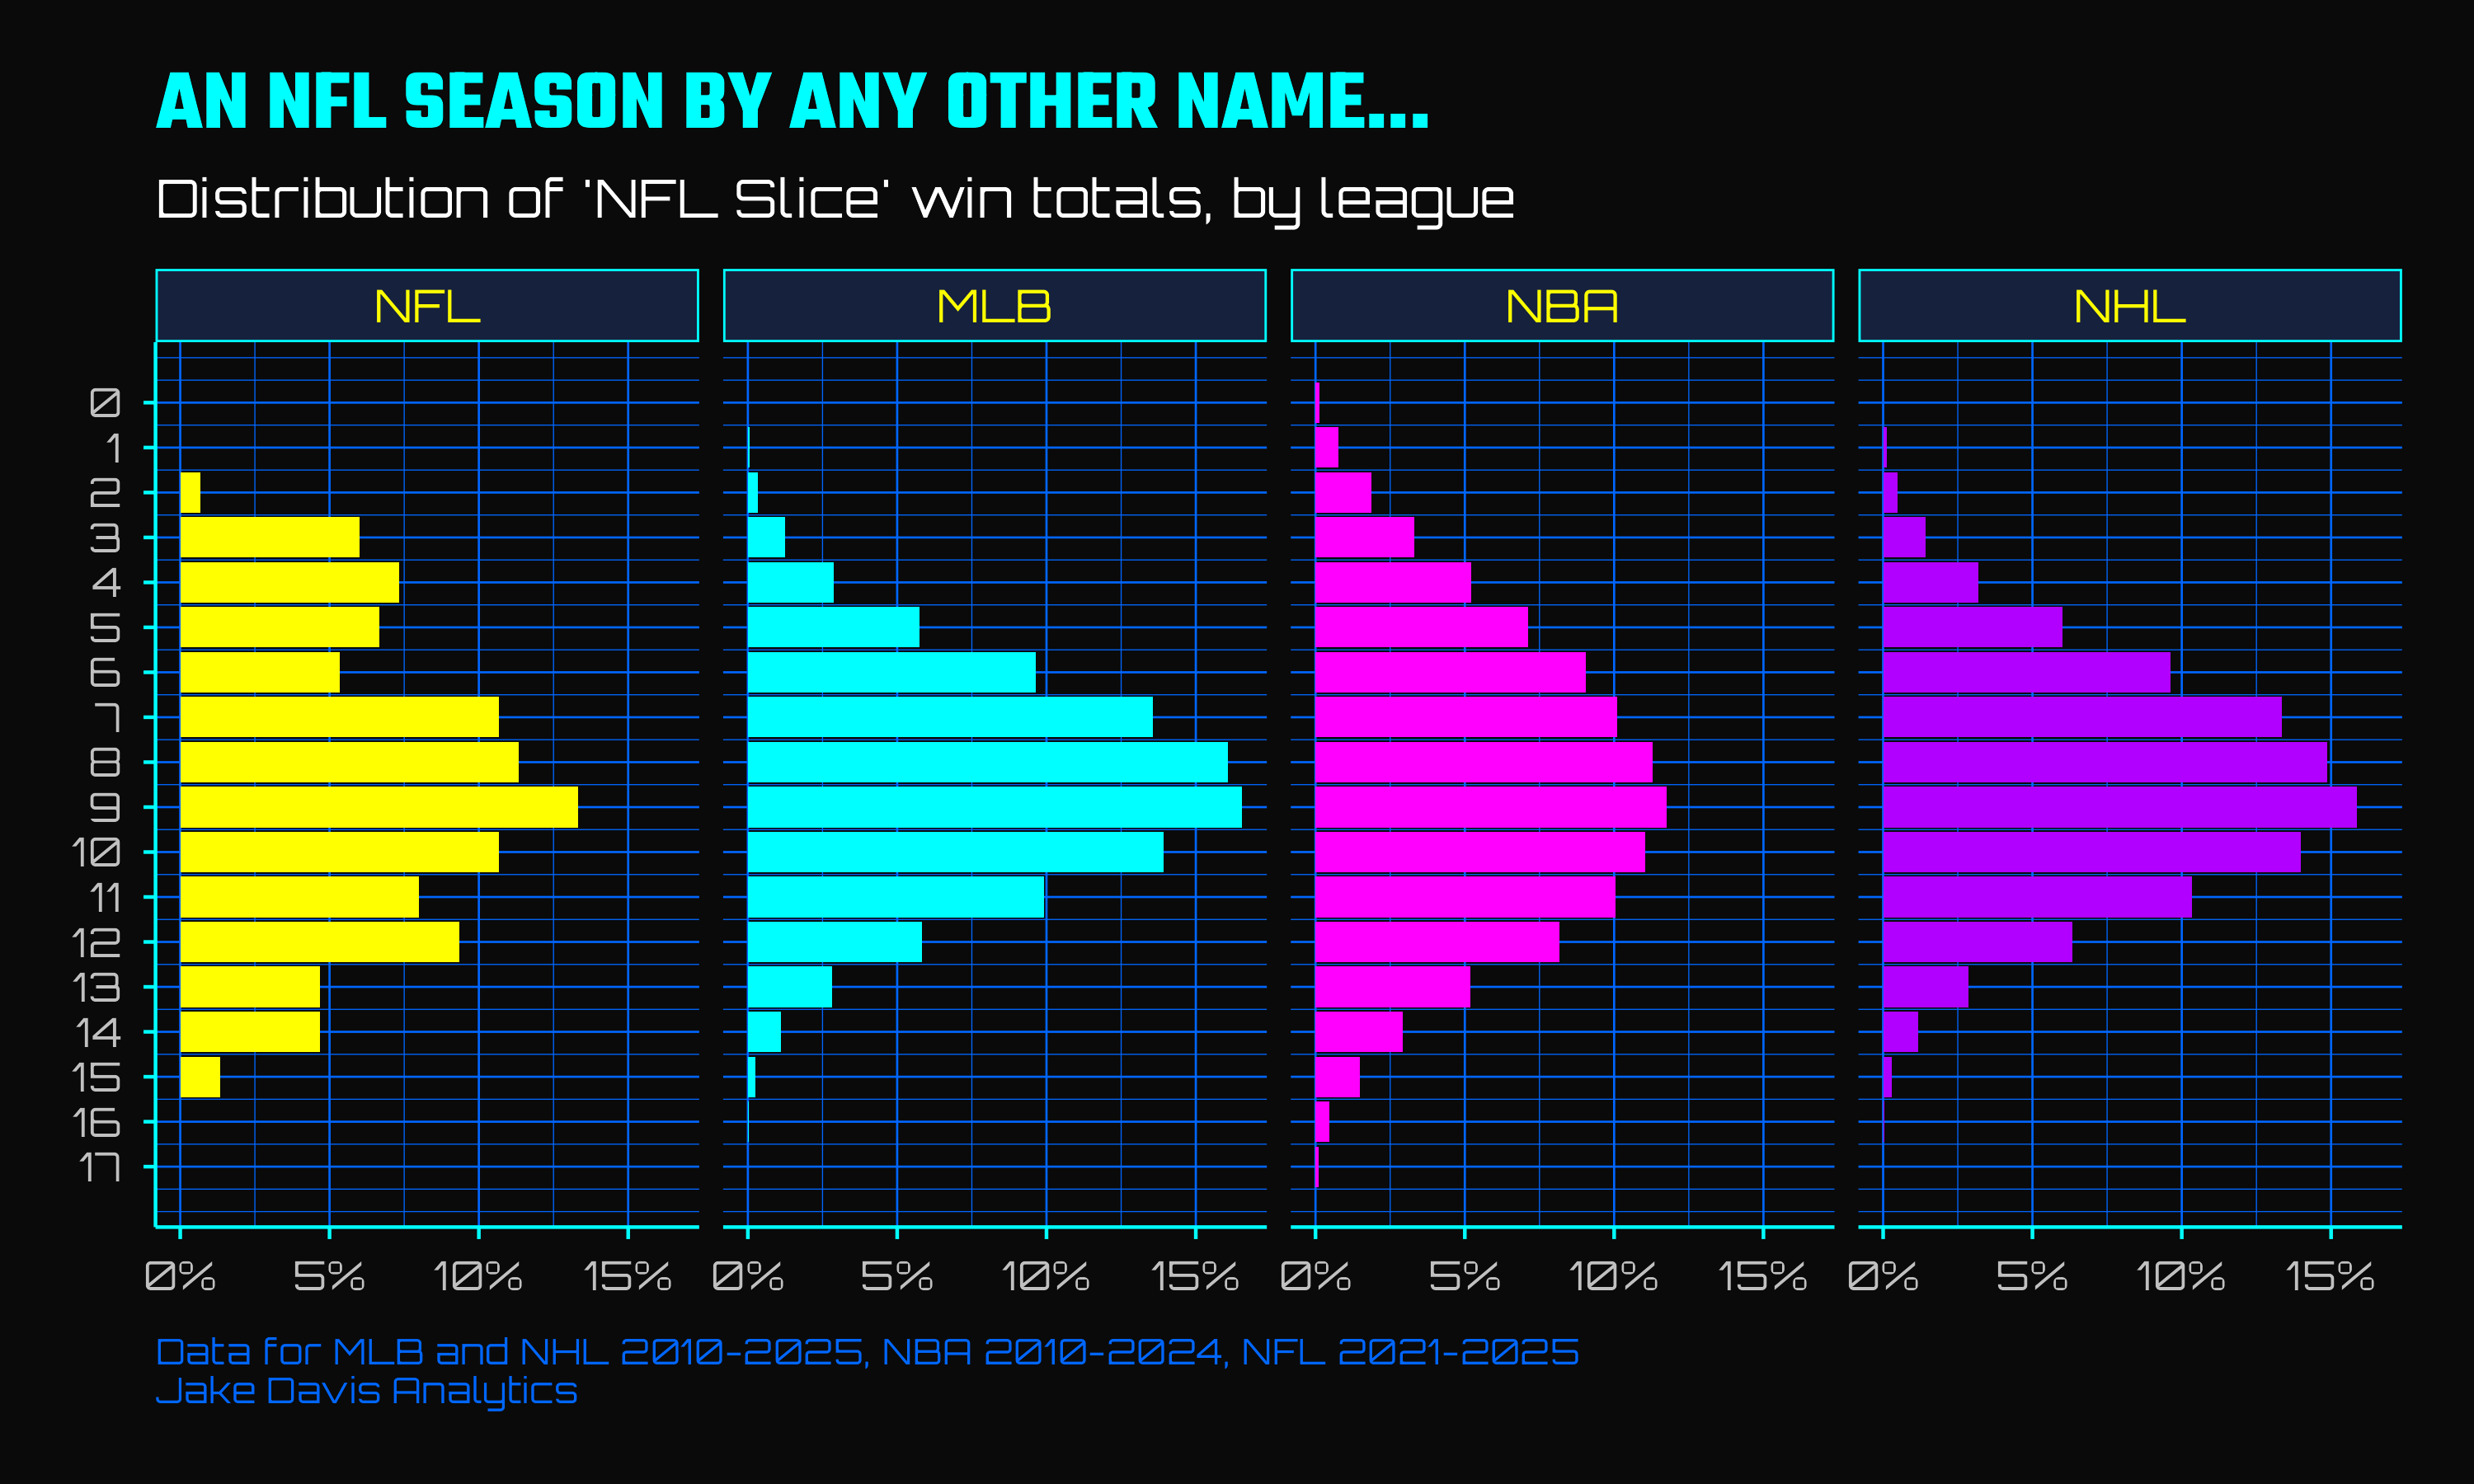
The general shape of an NFL slice across leagues is similar - wins are normally distributed11, centered around 9 wins. But there are some nuances - the MLB and NHL are noticeably skinnier, meaning that there is less team x NFL slice variance, while the NBA’s distribution is a close match to the NFLs. Said another way, an NBA team has roughly the same likelihood of going 13-4 over any given NFL slice as any NFL team12, whereas an MLB or NHL team is 40% less likely. Conversely, those latter two leagues are far more likely to go 10-7 (roughly 30% more likely). Skinnier distributions are also taller!
The shape similarity isn’t just a fun fact - it’s a statistical permission slip. If NBA, MLB, and NHL teams playing 17-game stretches produce win distributions that look roughly like what NFL teams produce over a full season, then those other leagues’ slice distributions are reasonable priors for the same uncertainty question that beta-binomial model answered above.
The “skinnier” distributions matter too - an MLB or NHL derived prior can be considered a more confident prior, since it already “thinks” extreme records are unlikely, and so therefore will pull estimates closer to the middle. So 3 more leagues, 3 alternatives on measuring uncertainty around a win-loss record. Yo, check out the pretty graphics:
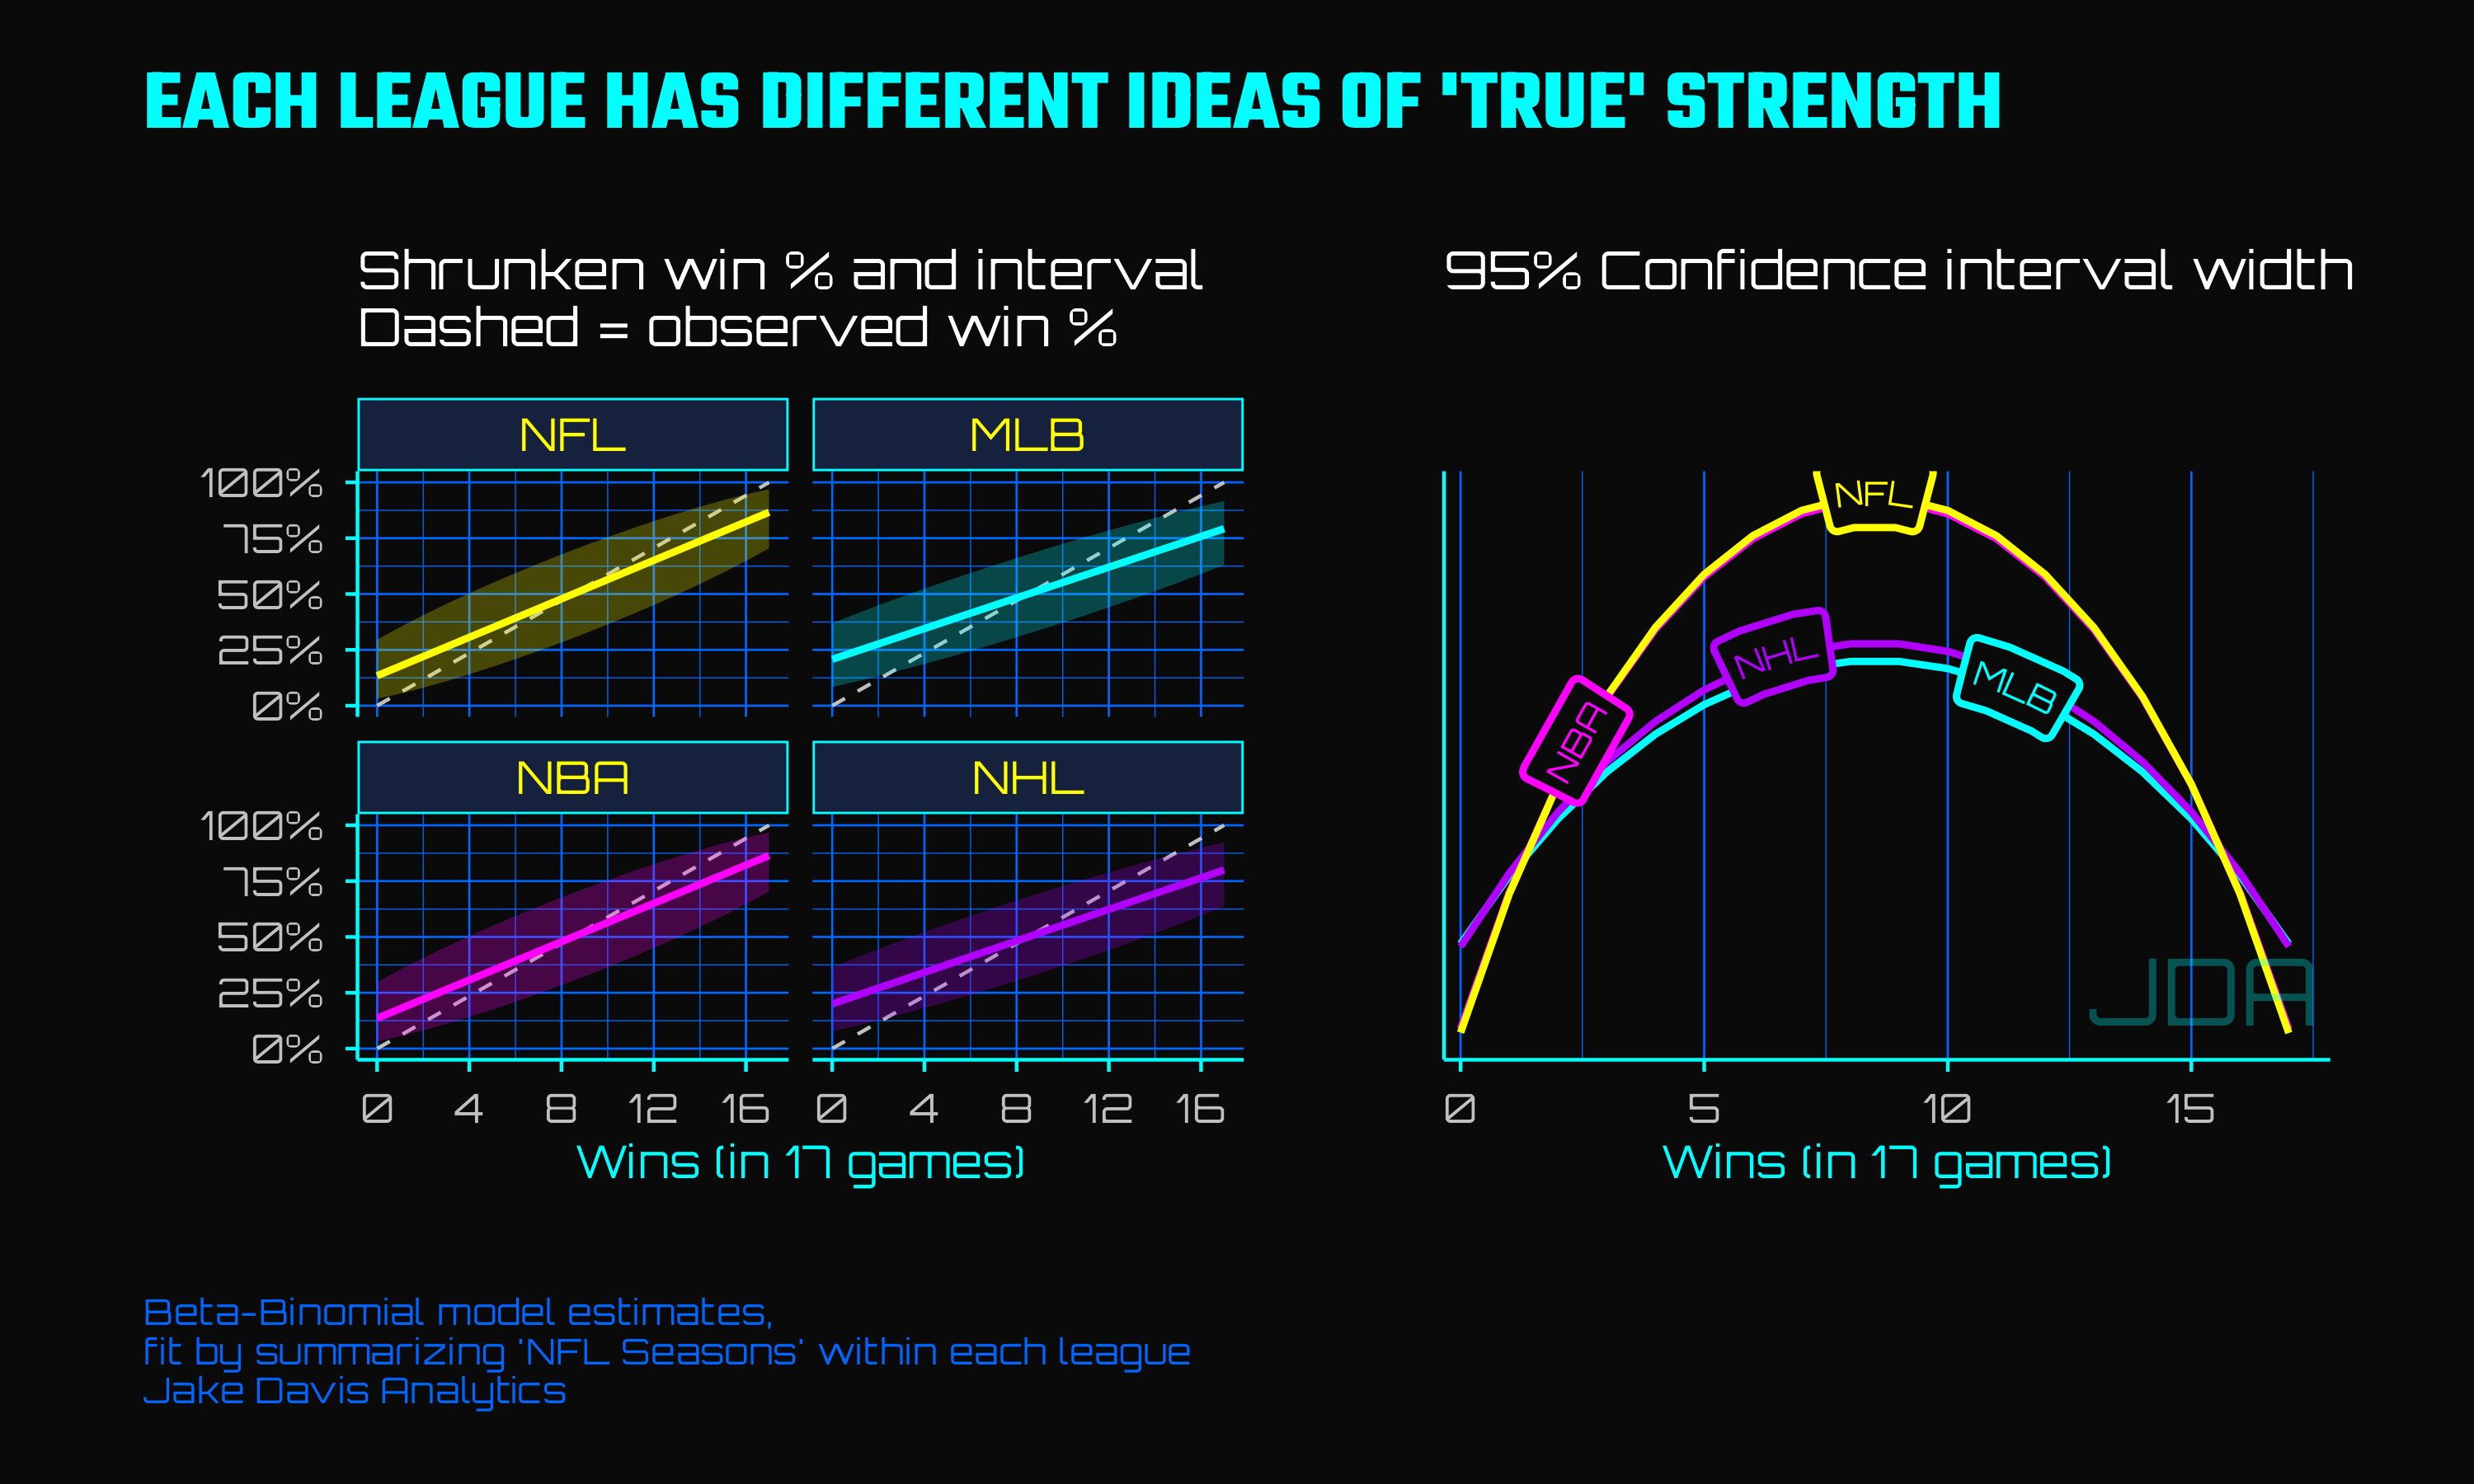
These charts show how much more aggressive an MLB or NHL derived prior pulls “true” estimated winning percentage towards the mean13 and how much narrower (i.e. how much more confident) the intervals are.
The idea of confidence in uncertainty can be tested in a different way - since each team in other leagues plays many NFL slices per season, you can examine how a record in any given NFL slice compares to the team’s final winning percentage.
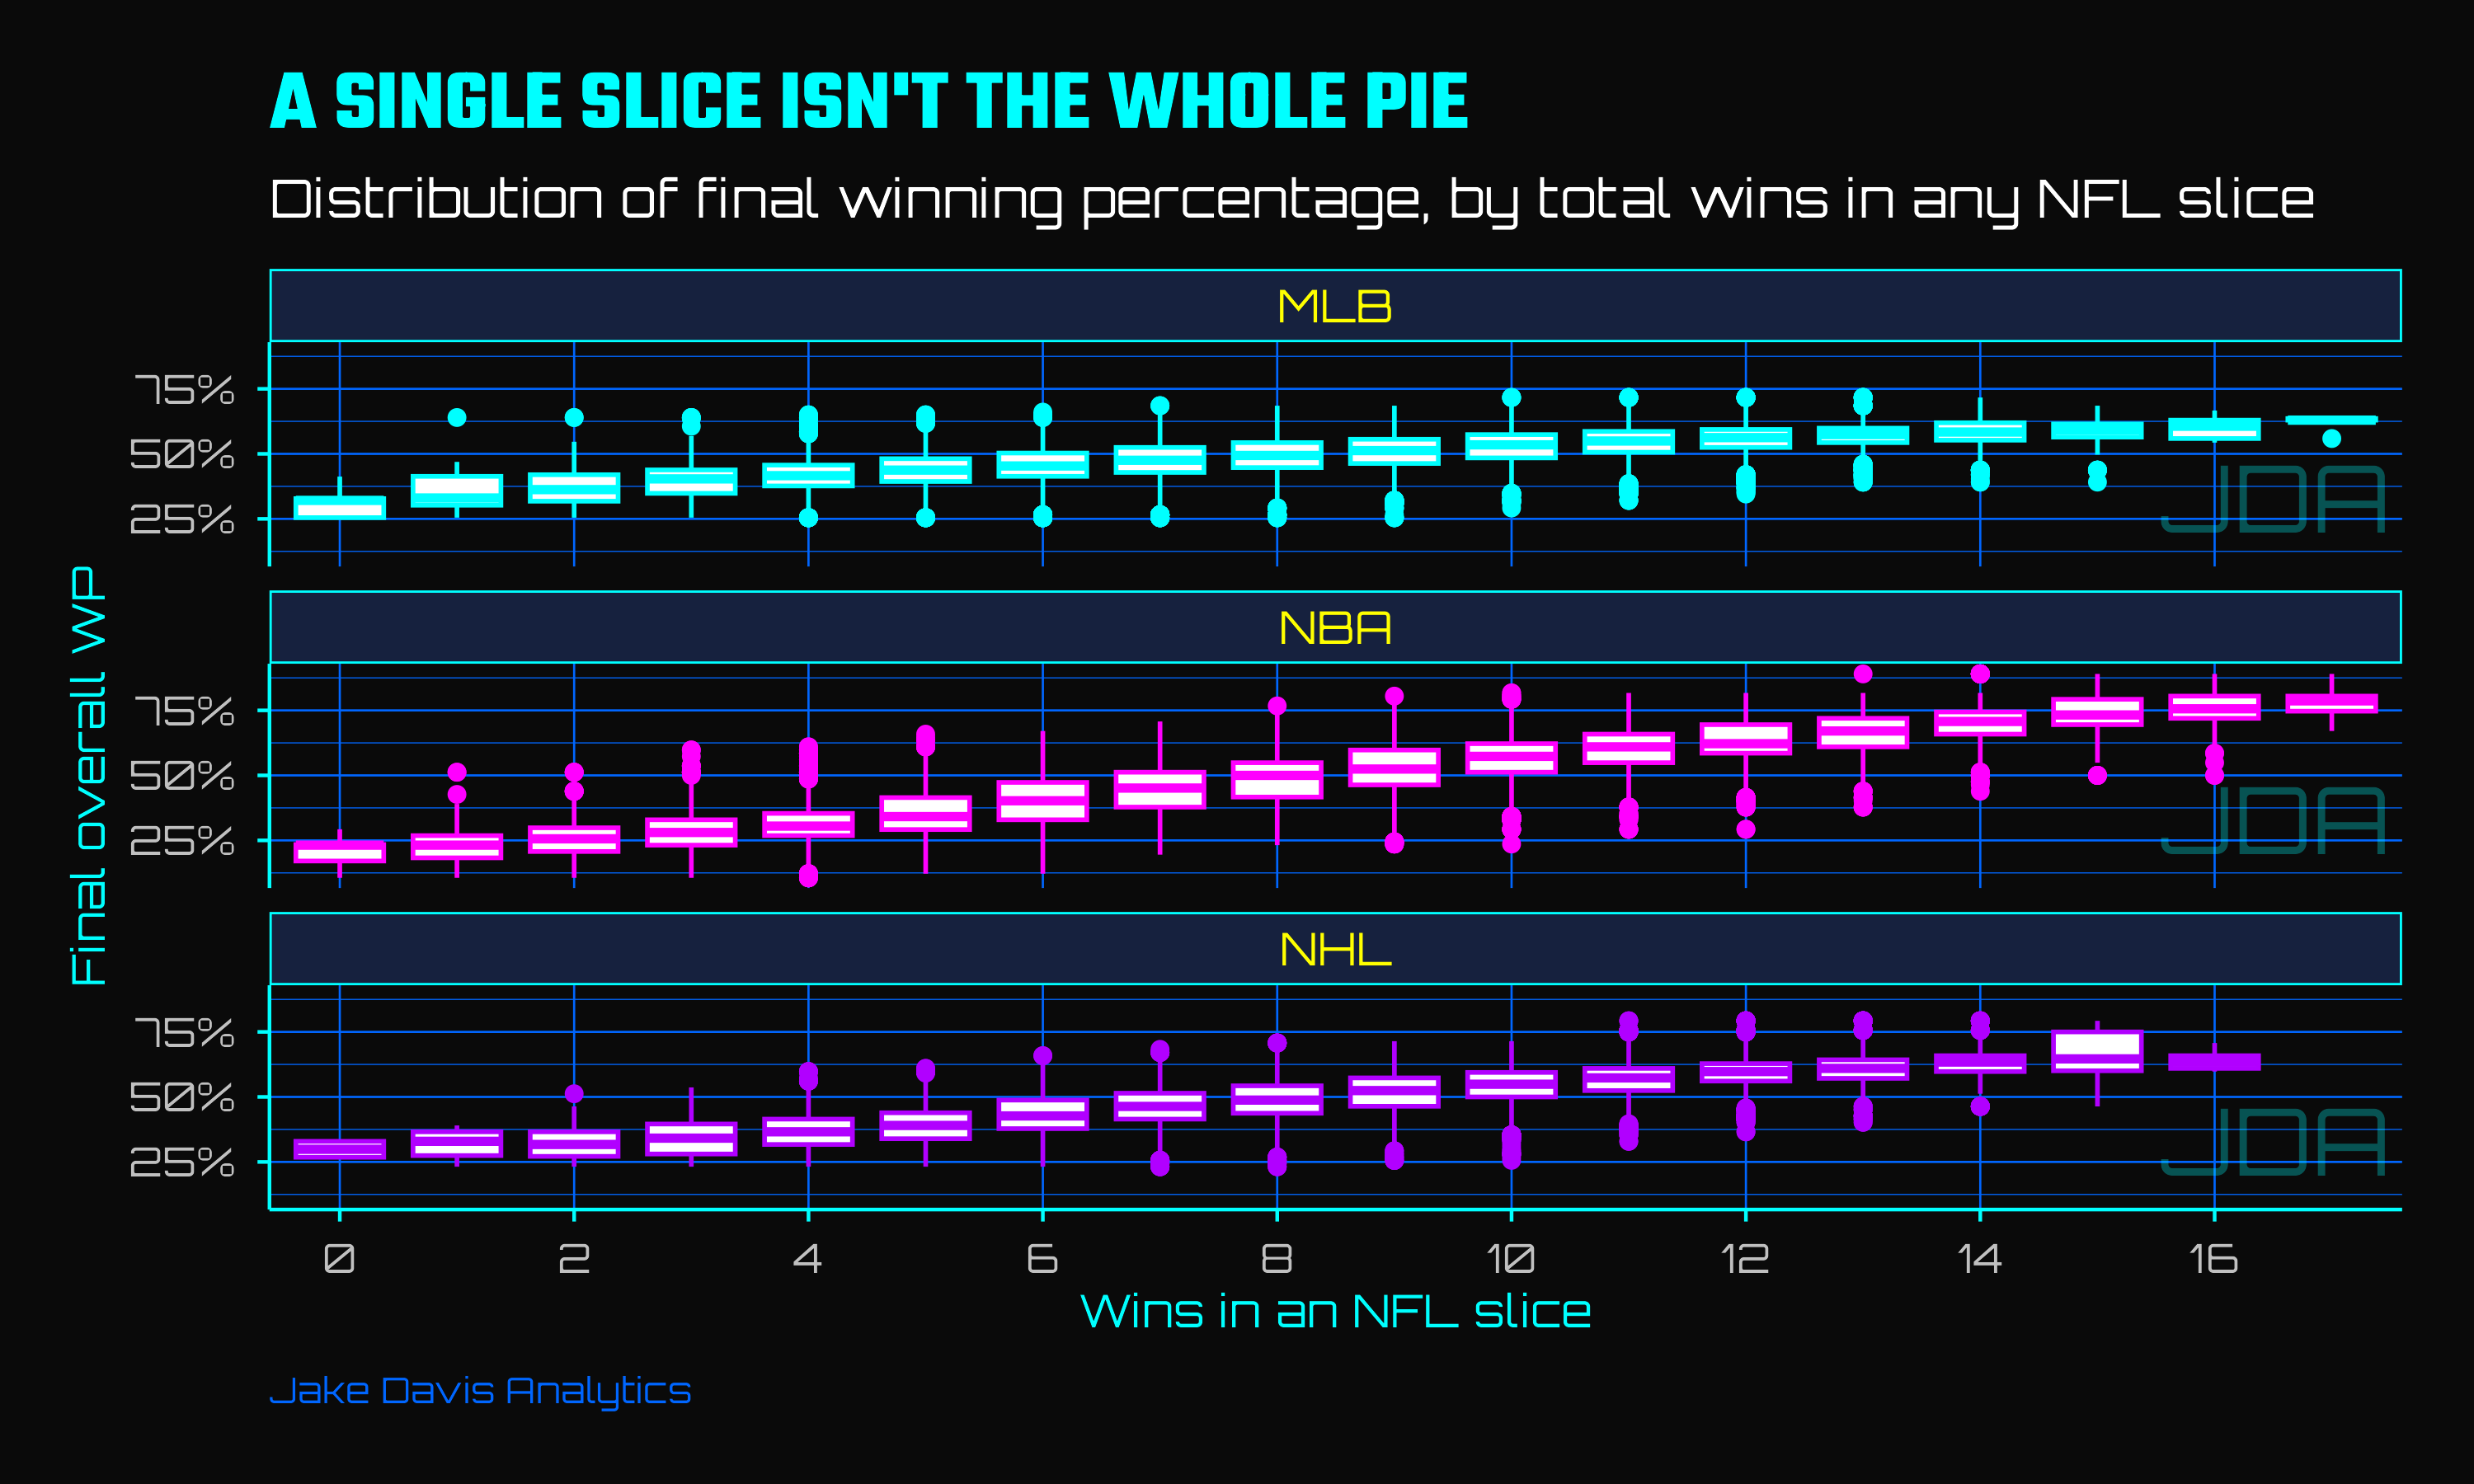
Wins in any given NFL slice are correlated with a team’s final winning percentage - bad teams are more likely to have an NFL slice with 1 win than good teams - but the correlation is weaker than you might expect.14 Sometimes, teams that had 1-win NFL slices finish above .50015, and teams going 15-2 in a slice may end with a sub .400 winning percentage.16 Now, how certain are you that the Steelers’ 10-7 record was really playoff worthy?17
As illustrated above, small samples aren’t worthless - they just carry uncertainty along for the ride. For example, if you isolate a team’s worst NFL slice, you likely can tell something meaningful about its’ best NFL slice:
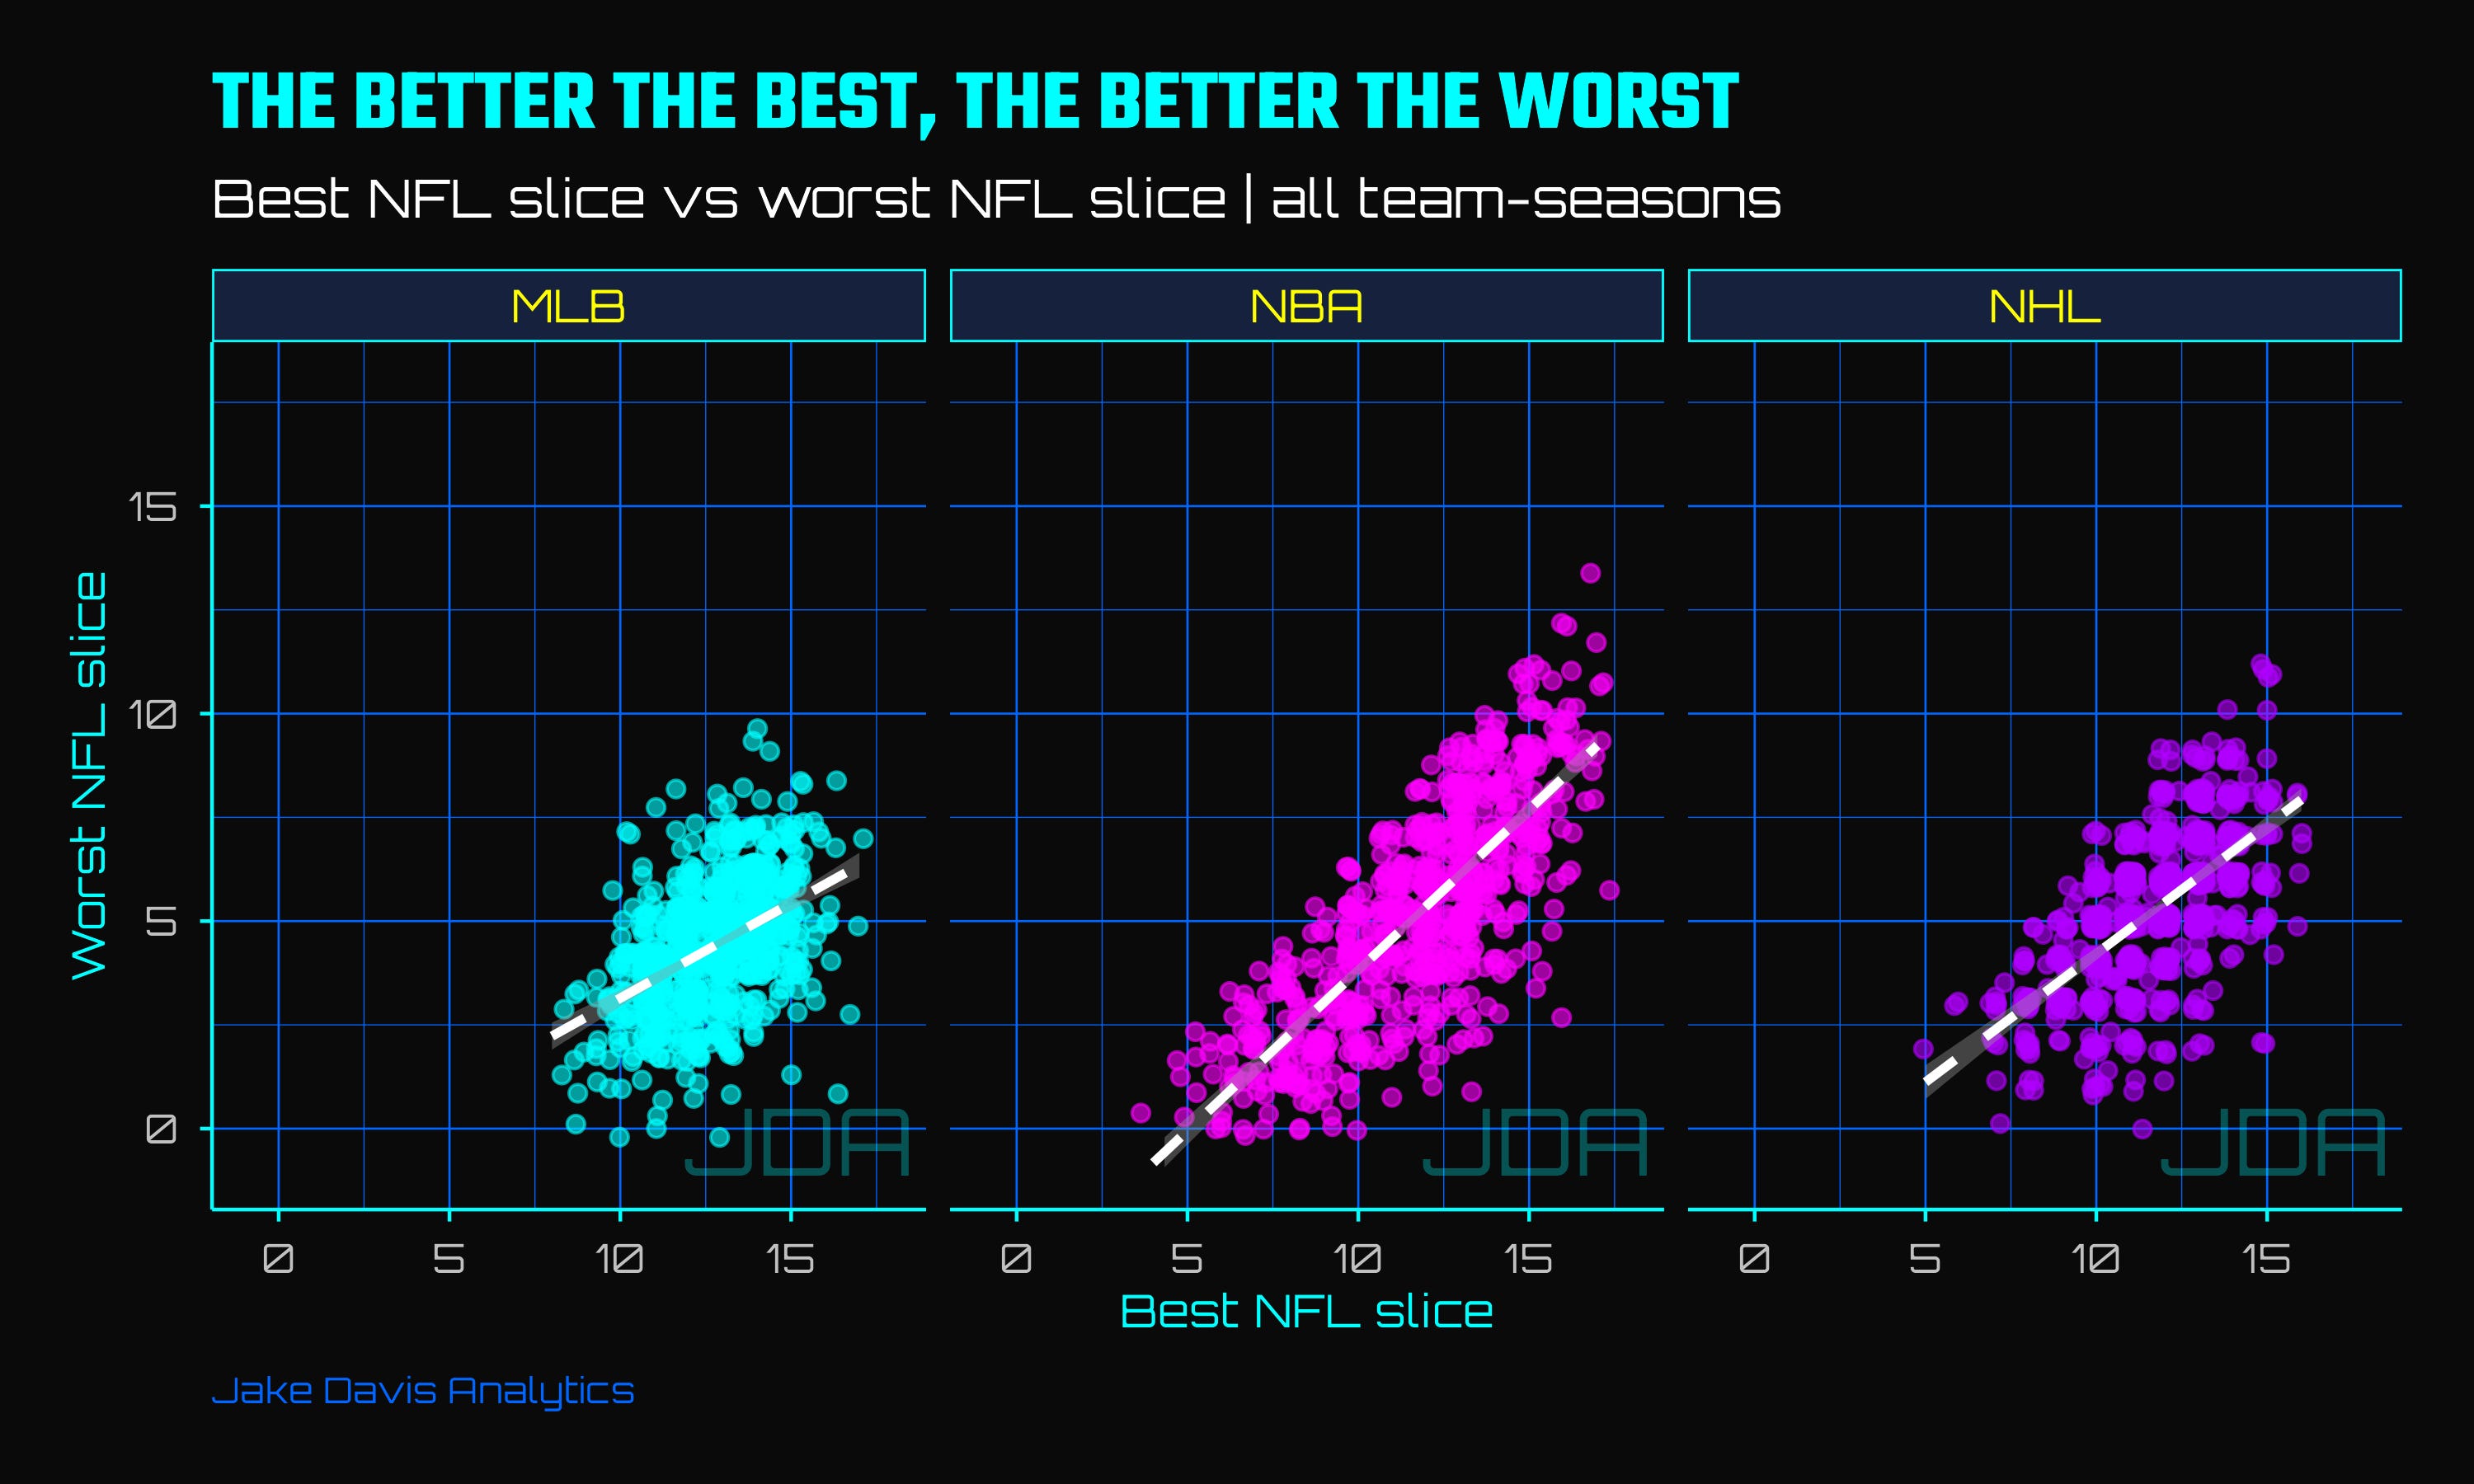
In the NBA, the correlation is strong (.79). It’s still fairly strong in the NHL (.62), but is much weaker in the MLB (.45). What’s more interesting - at least to me - is that the best and worst NFL slice carry similar amounts of information about a team’s final winning percentage. Outside of some minor rounding, the best and worst NFL slice are equally (and strongly) correlated with the final win percentage across all leagues (.76 - MLB, .92 - NBA, .85 - NHL).
Okay, I promised that using the other leagues would be less statistically theoretical, and here I am talking correlation again. Another, less technical way to examine how much or little an NFL season tells us is to examine other leagues for how likely an “historic” run is - how likely is it that a team will go 15-2 during a season?
In the NFL, going 15-2 or better is a historically great season - it’s happened exactly twice since 2021. But if other leagues’ teams are playing dozens of NFL slices per season, how often should you expect to see a 15-2 or better stretch from any given team? The answer makes you rethink what “historic” actually means when your sample is small enough.
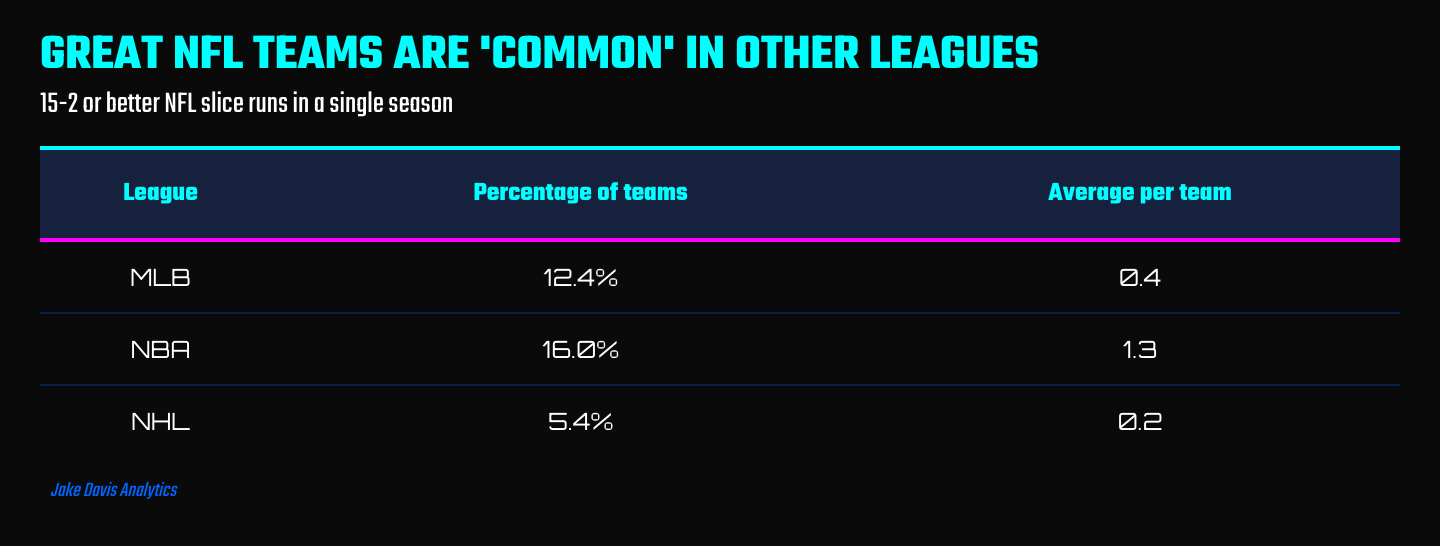
In the NBA, you should expect each team to roughly have one 15-2 or better NFL slice per season!
What if instead of looking at records across slices, you just ran the playoffs for each one? Take every NFL slice in a league season, roughly apply the NFL’s 14 team playoff structure to that slice’s standings, and count how many unique teams would have punched a ticket at some point during the year. If records were stable and meaningful, you’d expect roughly the same 14 teams every time. If they’re noisy, the field should look very different slice to slice. Let’s see how these “phantom playoffs” net out:
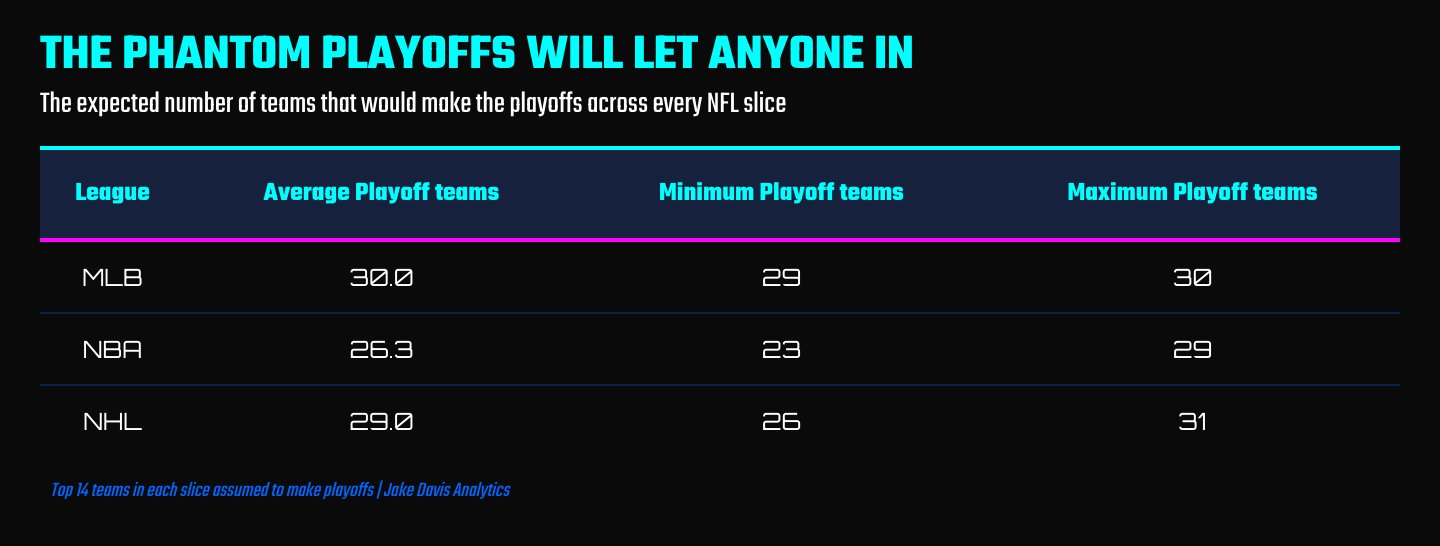
Yeah, there are 30 total teams in the MLB, and they all make the Phantom Playoffs, on average.
All of this analysis keeps pointing to a straightforward conclusion - an NFL season isn’t long enough to tell us much about the teams, and if you assume that an NFL team has similar variance to teams in other major sports, well, then the NFL season tells us very little indeed about who is “best”.
Taking this idea to its logical conclusion means there is only one thing left to do - simulate an NFL season, as if it were much longer! As an example, you can examine the 2025 Seattle Seahawks - Super Bowl champs! - and pretend like their 14-3 season was just one NFL slice in a much longer season. Earlier in the analysis, I developed a few models for what uncertainty can be drawn around an NFL Slice, and they can be used now - the Beta-Binomial model, and the observed final winning percentage based on a slice from each league. Do some math, dial up 10,000 simulated universes, and voilà - your 2025 Seahawks, but if they played18 in every other league:
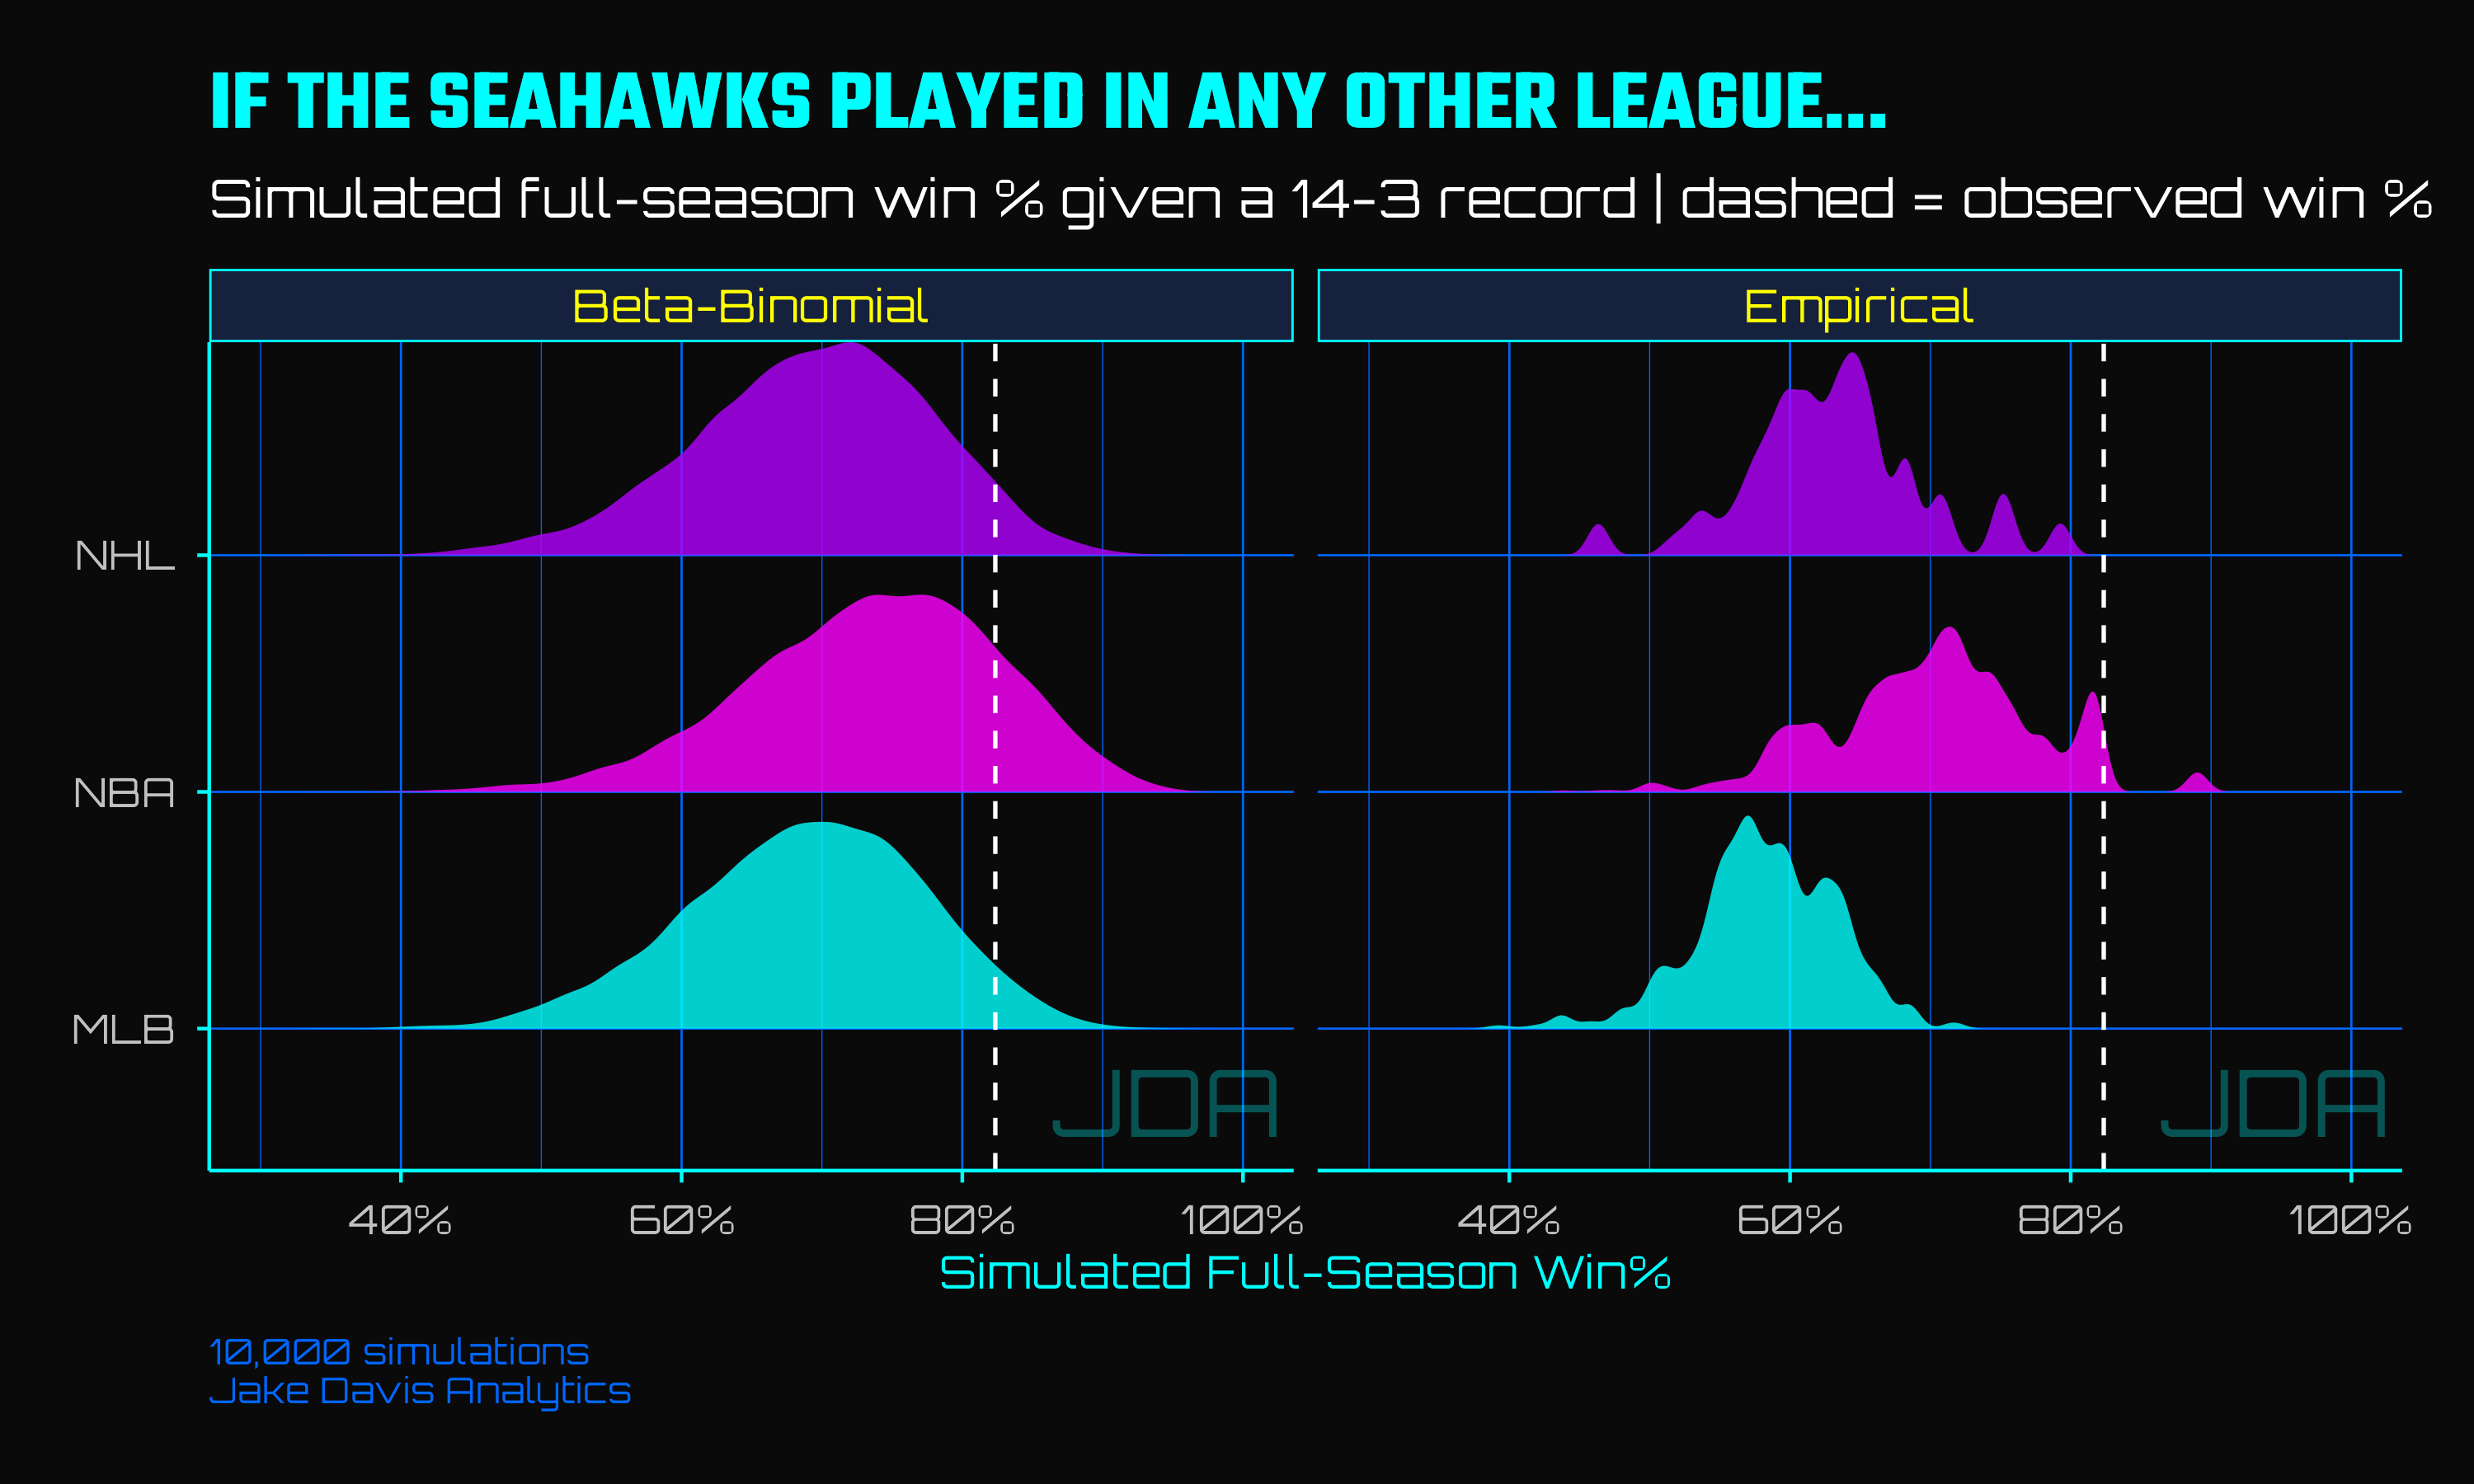
Across all leagues, the Seahawks aren’t quite as good as their NFL slice suggests - finishing with an average win percentage of 70.6% according to the Beta-Binomial simulations and 64% according to the empirical model. That’s a 12-win and 10-win season, respectively. A fine-to-good outcome, but unlikely to be the best in the league.
But this can be taken further by asking “if the Seahawks played in these other leagues, how likely would it be for them to win the championship?” And this can be tested by training a series of simple models that use winning percentage as the lone predictor for likelihood to win the championship19. Pass the simulated final season “true” winning percentage, and now you’re talking - a distribution of simulated universes, and the likelihood that the Seahawk’s win that leagues championship
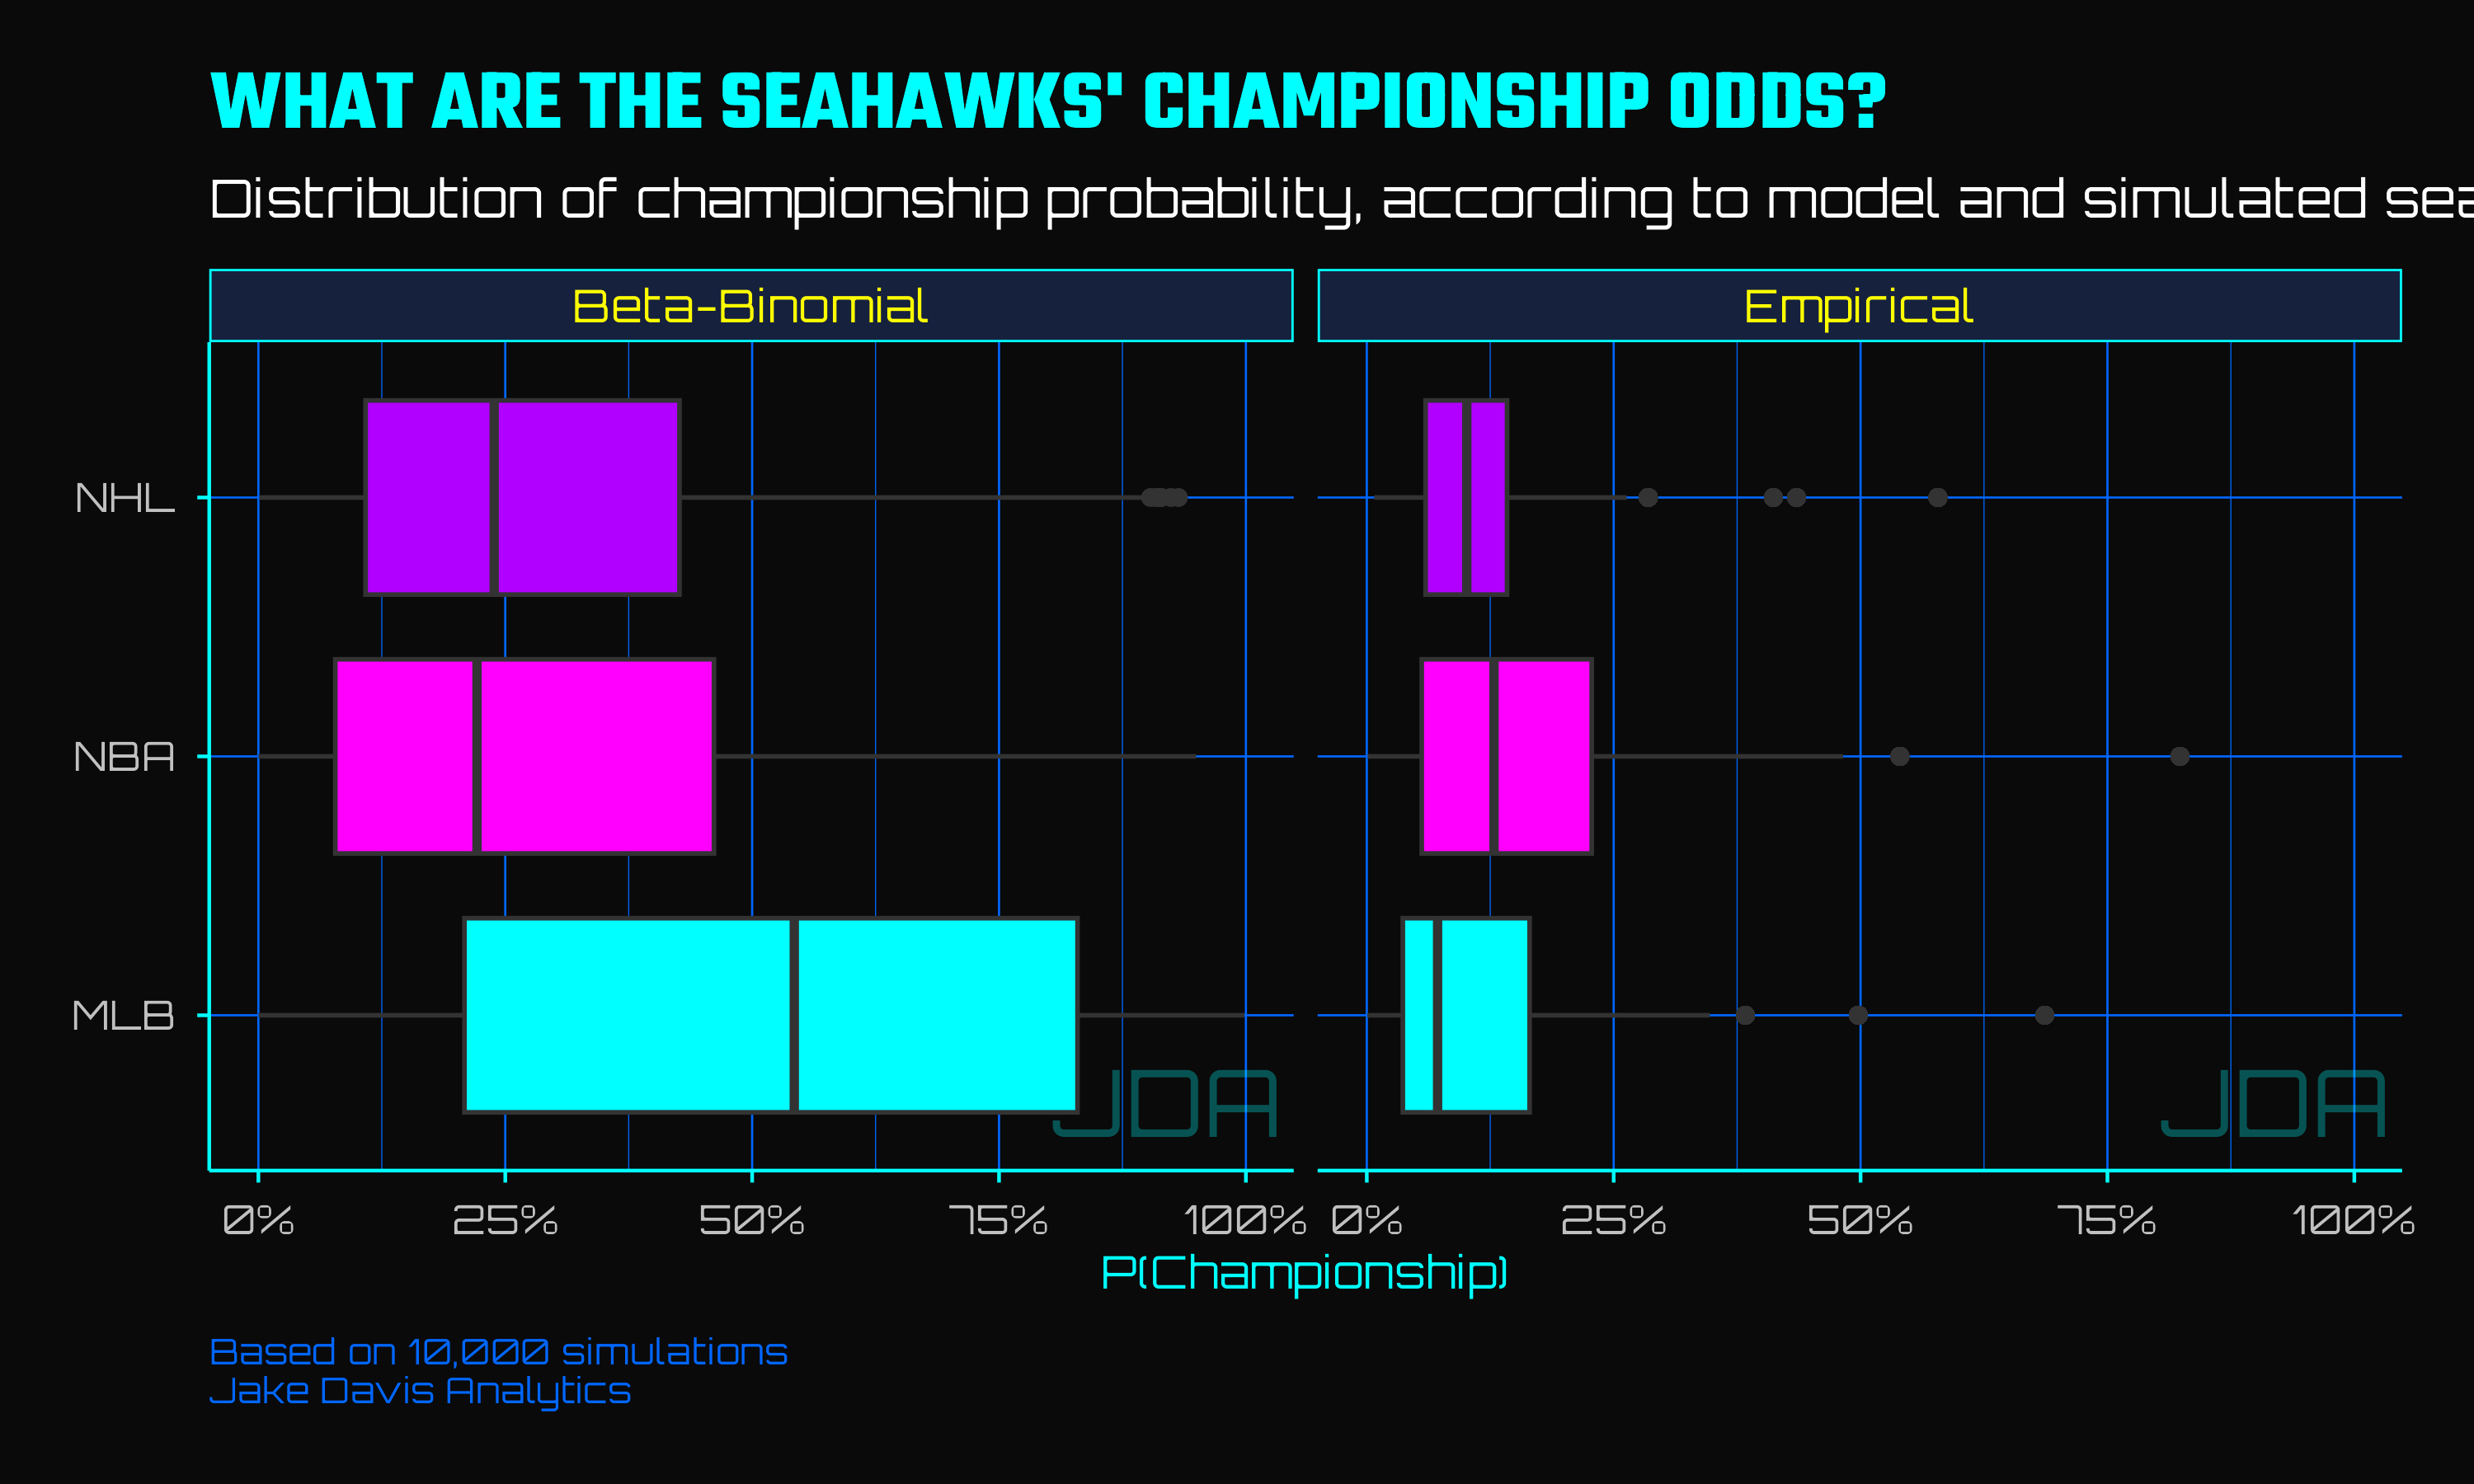
If you assume these20 simulations contain some truth, then the Seahawks only have somewhere between a 14% (empirical model) and 37% (Beta-Binomial) chance of winning a league’s championship, on average. Small samples, man.
So - were the Seattle Seahawks the best team in football last season? Maybe. Probably, even. But “probably” is doing a lot of work in that sentence, and it’s information that a win-loss record simply doesn't provide. The analysis above isn’t an argument that records are meaningless - they’re not, and the correlations show that clearly enough. It’s an argument that they’re noisier than they look, that the gap between “best record” and “best team” is wider than fans tend to assume, and that the NFL’s short season makes that gap almost impossible to close with wins and losses alone. The Seahawks earned their championship. Whether they were the best team in football is a question the schedule simply didn’t give us enough games to answer - maybe they were, maybe they weren’t, but analyzing their record alone won’t tell you that.
Thanks for taking the time
-Jake
Sources
NFL data from nflreadr package, all games excluding ties from 2021-2025
MLB data from baseballr package, all games excluding ties from 2002-2025
NBA data from hoopR package, all games excluding ties from 2002-2025
NHL data from hockeyR package, all games excluding ties from 2002-2025
And tied for the best record (but had the best point differential)
Some of them aren’t even the Pittsburgh Steelers!
Whatever that means (SUB-FOOTNOTE, “and we’ll get to that”)
According to the Clopper-Pearson exact interval; 95% CI for 10 wins in 17 games is [0.329, 0.816]. The Wilson interval is slightly narrower but tells the same story at this sample size.
You don’t exist, at least not yet - you’re just in my head
Prior fit via method of moments to historical NFL win% mean (.5) and standard deviation (.186). Posterior is Beta(α + 10, β + 7) where α, β parameterize the prior.
Excluding ties, because ties suck
One of my favorite illustrative ideas on this chart is that teams that win 0 or 17 games are never estimated to be in the 0 or 100% range by the beta-binomial model - statistically, those are just aberrations outside of the 95% credible interval
This means that, barring weird scheduling, MLB teams play 146 NFL seasons per year, NBA and NHL teams play 66
And I won’t admit how much “data science” I needed to do to make that visualization, which may or may not be actually additive to your understanding, but was still a fun challenge
Though note how much smoother the other leagues are relative to the NFL - this is due to sample size, or as the kids back in high school called it, the central limit theorem
5.2% vs 4.6%, NBA to NFL
As an example, a 14 win team (82% observed wining percentage) gets pulled down 16% (to 68%) with an MLB prior vs 10% with an NFL prior
.54 for MLB, .81 NBA, .68 NHL, all significant at p = .001
01-02 Raptors, I see you
The Minnesota Twins (2011 edition), though the Twins show up in a 15-2, sub .500 query in multiple seasons
It very much was not playoff worthy
They don’t, and this is just for fun! This simulation is fairly simple, using a simple model, whereas the NFL and NBA are wildly different beasts, as are the MLB and NHL - there really isn’t a great reason to assume they’d behave remotely similar.
Championship probability estimated via logistic regression
P(champion | win%) fit separately per league on historical team-season data, with a binary champion indicator as the outcome and full-season win% as the sole predictor.
Simulated win percentages from each method are passed through the fitted model to produce a probability distribution rather than a point estimate. Note that this single-stage formulation conflates strength signal with bracket luck - the coefficient absorbs both the probability of being good enough to contend and the probability of surviving the playoff structure once there, which varies across leagues.
extremely made-up