



A few years back, about a week into the 2022 season, I posted a pair of tables to Twitter1.
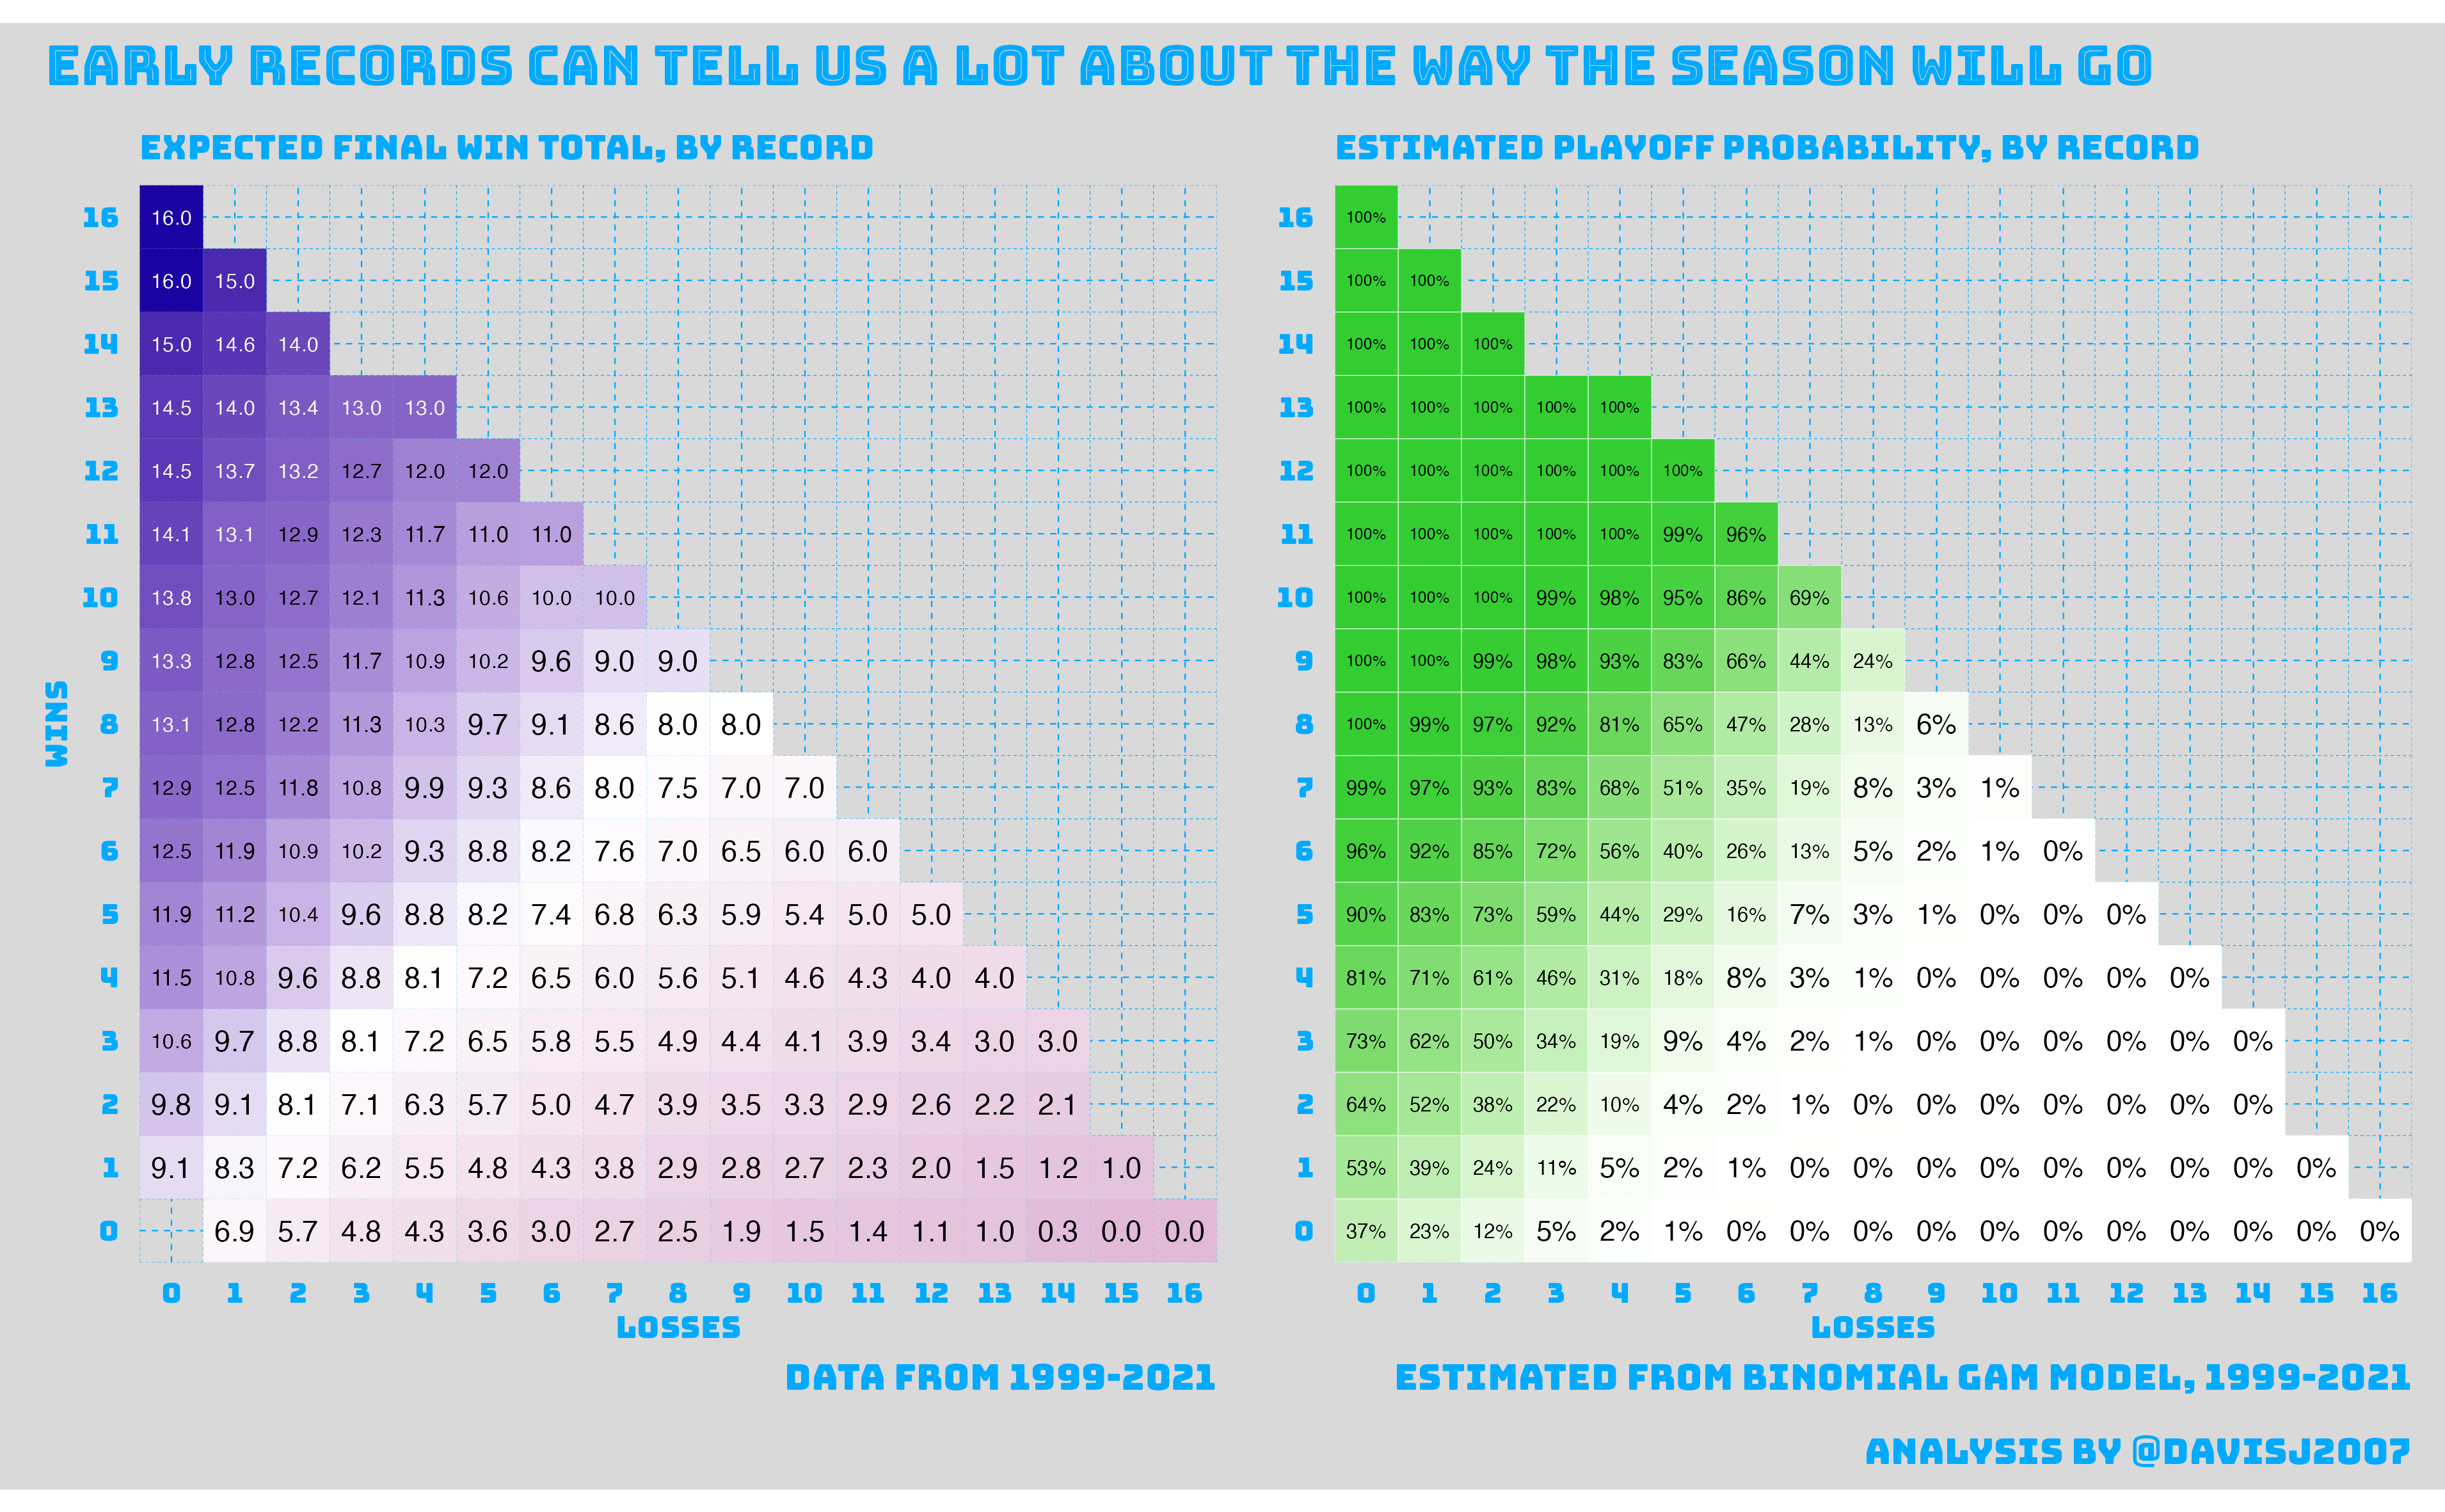
I had stolen the idea I posted from Benjamin Morris, who at the time was writing for the old FiveThirtyEight,2 and which of course has been lost to the digital trash bin. The tables are simpler than they appear - one showed how many games a team with a given record is expected to end up winning; the other, how likely that team was to make the playoffs. The thread ended with the only piece of football advice I am qualified to give - don’t go 0-2.
Two months ago I wrote a few thousand words arguing that an NFL record is a super noisy, small-sample estimate of how good a team actually is, and that a 10-7 team is statistically consistent with being anything from a 6-win team to a 13-win team.
If those two things sound like they disagree - don’t go 0-2 but also don’t trust your record - trust your instincts. But they only disagree in that they are both noisy, and noisy doesn’t necessarily mean uninformative. The question that matters in October isn’t “is the record right?”3 but “how much should I believe it?”. You’ll be surprised to learn (not) that it turns out to have a fairly specific answer.
Which brings me to the Houston Texans, proud owners of an 0-4 record.
They lost to Buffalo by 5, Cincinnati by 14, Indianapolis by 2 and Dallas by 4. Three of those four were one-score games, and this is a team coming off a 12-win season. If you’re a Texans fan, you’ve probably heard some version of “it’s early” this week, as well as some version of “they’re cooked.”
And cooked they may be! Since 1999, 81 teams have started 0-4, and a great big zero of them made the playoffs.
But CJ Stroud is back, the Texans fan yell - we can recover! And maybe they can - over that same stretch, 129 teams started 0-3, and two of them made the playoffs anyway. Both of them were the Houston Texans.4. The 2018 team went 0-3 and won the division at 11-5. The 2025 team went 0-3 and finished 12-5.
So which is it? Let’s find out how much four games actually might tell us.
There tend to be two ways to think about an early record, and if you’re like me, the way you choose is heavily related to how much you like the team you’re talking about.
The first one is that it’s early. Everybody’s more or less 0-0. Four games is nothing, the season is long, and a 3-1 team and a 1-3 team are both just teams that played four football games. I think of this as “the coin-flip view” of the world - whatever happened so far, the rest of the season is a .500 proposition.
The second way is that the record tells us everything. A 3-1 team is a 75% team, so pencil them in for 12 or 13 wins. Coincidentally, this is the view of every local radio DJ in a city with a 3-1 team.
You know what site you’re on,5 so you know there are some statistics we can do to test these perspectives.. If the coin-flip view is right, a 3-1 team should finish with 3 + (13 × .5) = 9.5 wins on average. If the record-tells-us view is right, they should finish with 12.75. History has a lot of 3-1 teams in it, so boop boop beep into the console and we can check.
I took every regular season from 1999 through 2025, followed each team week by week, and recorded where they finished. This isn’t intense analytics work, just a lot of rows.6 Then I fit a model to smooth the table out, because some records (say, 7-0) just don’t happen enough for an arithmetic mean to be useful.7
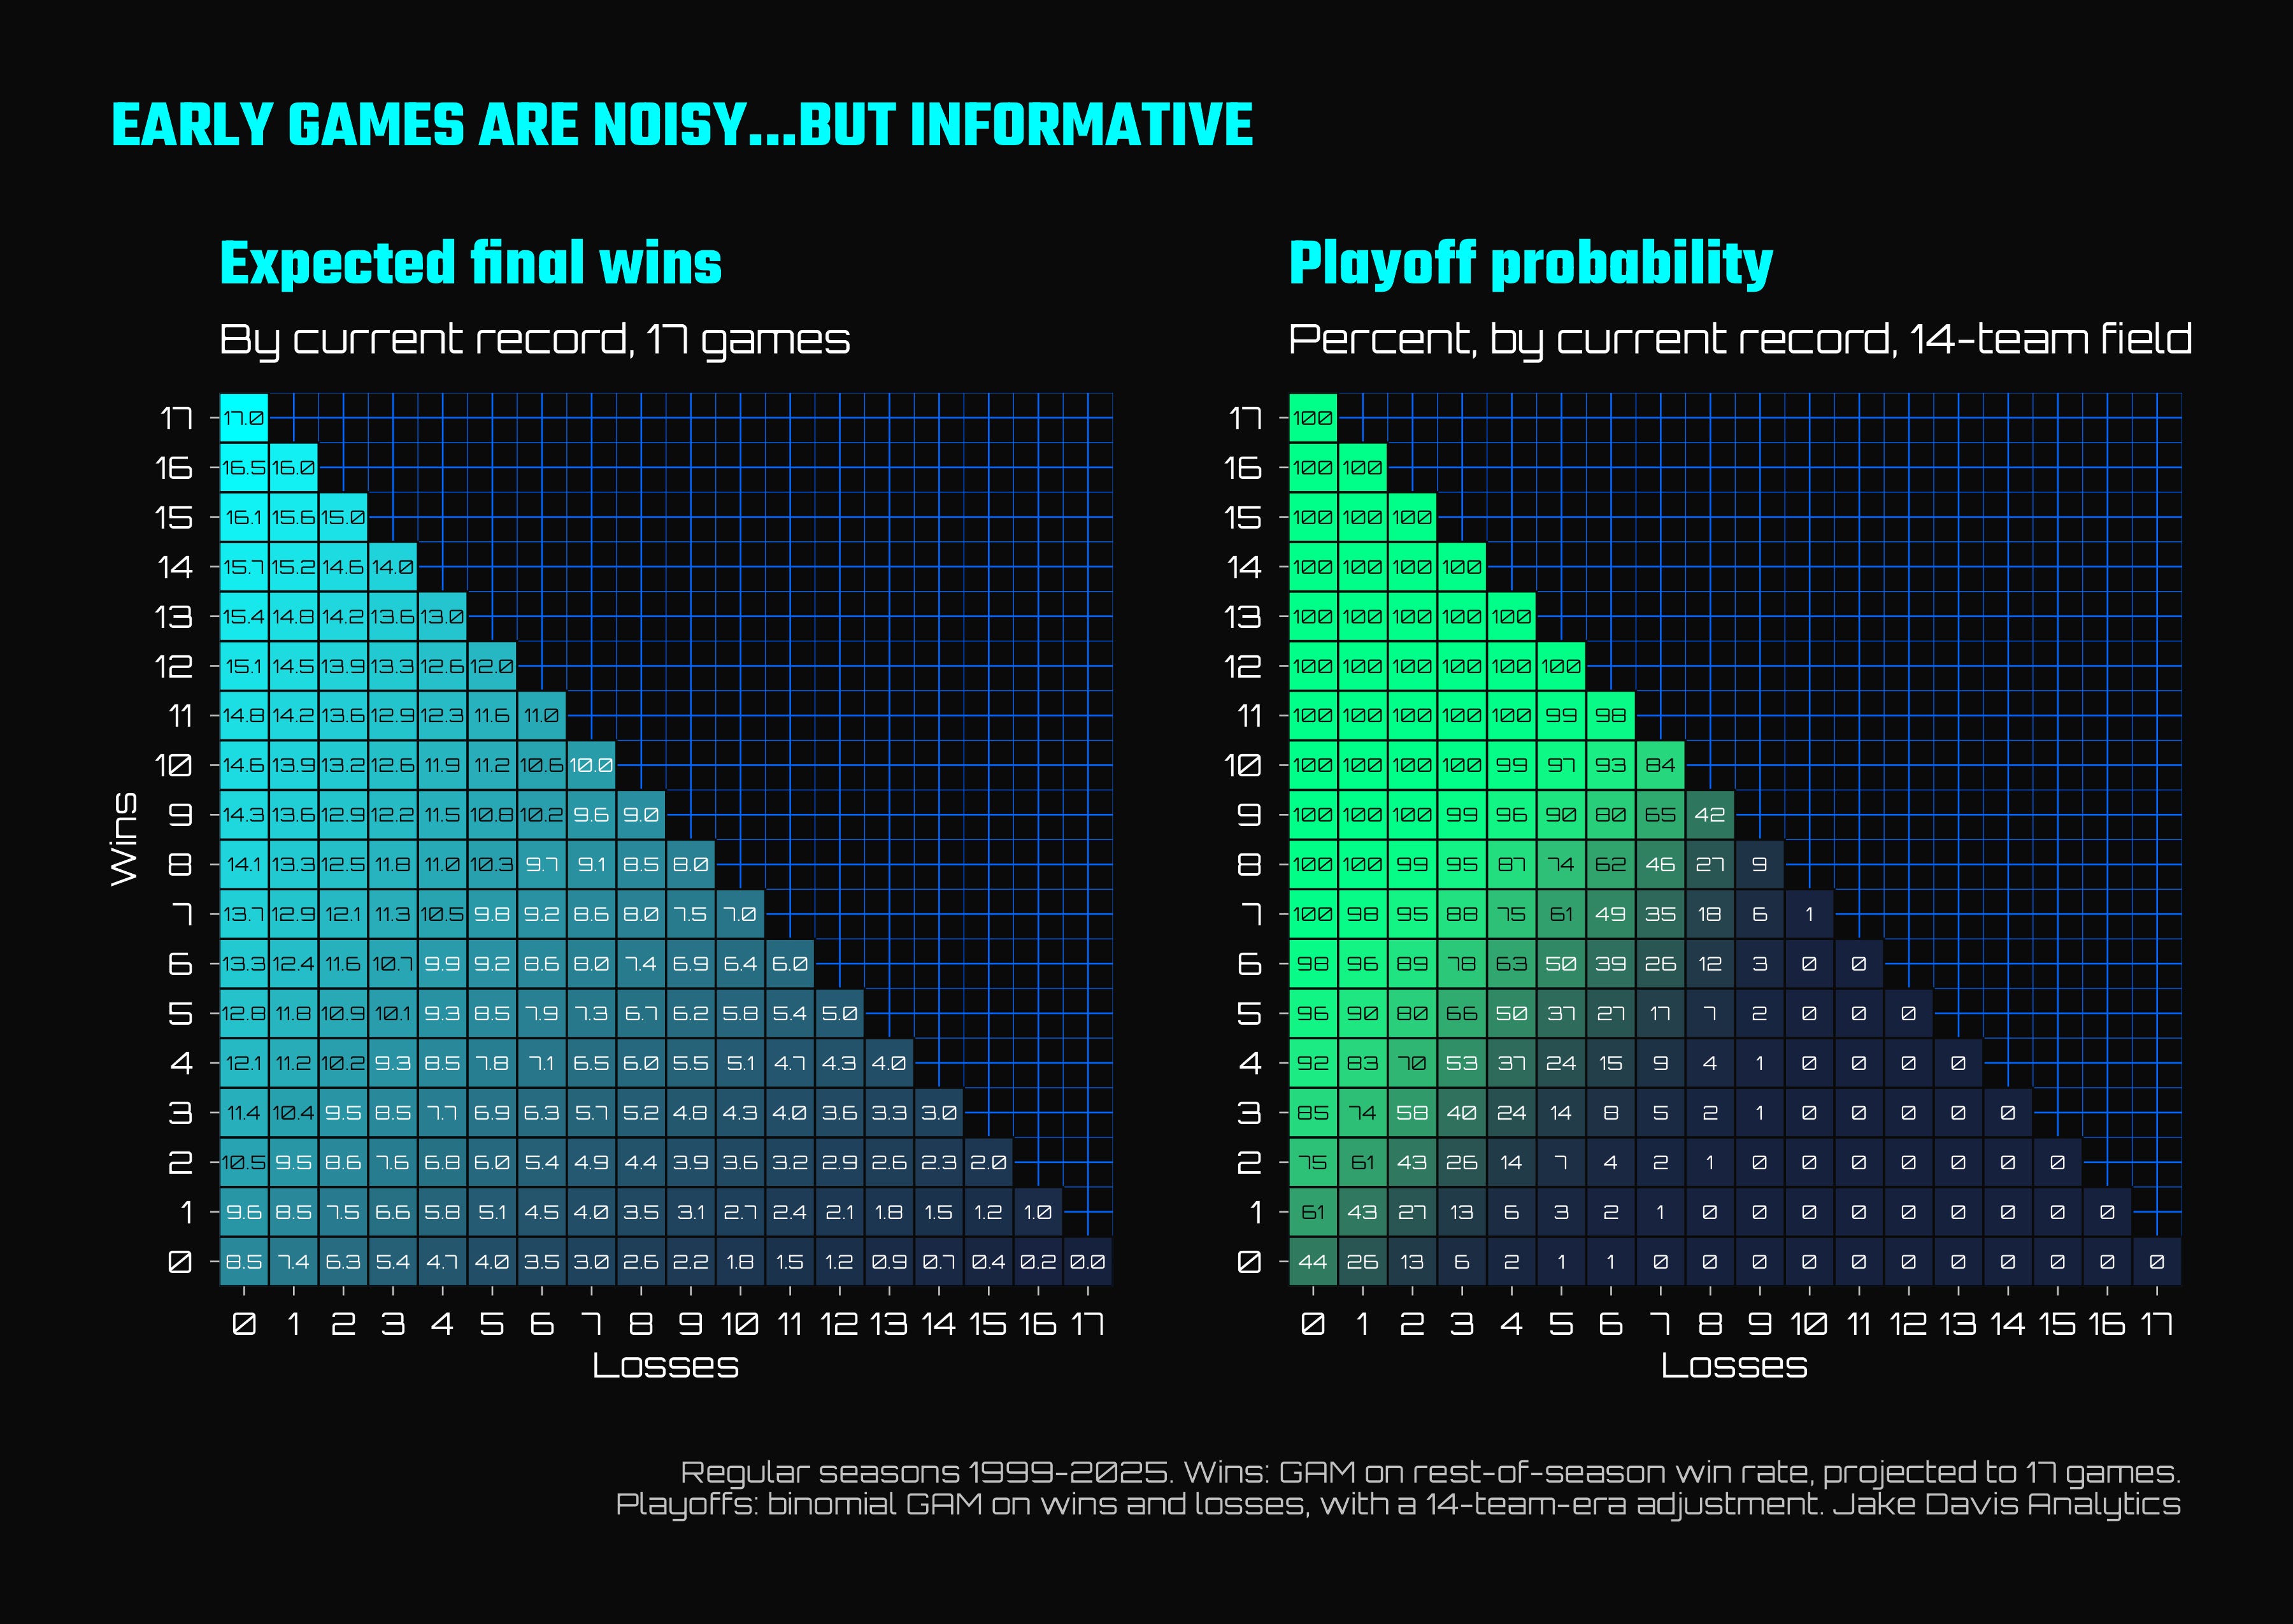
Win-Loss records are read by column to row - the diagonal follows a set of games played: 4-0, 3-1, 2-2, 1-3, 0-4 are all records from teams that have played only four games.
So where does a 3-1 team land? According to this method, at about 10.4 wins. That’s a win more than the coin-flip method would predict (9.5) and more than two shy of the local radio hosts’ 12.75 prediction.
This estimation method shows how a single game can be incredibly important - a 1-0 start should land a team with an expected win total 2.2 wins ahead of a 0-1 team (9.6 wins vs 7.4).
And what about Houston land? At 4.7 wins and a 2% chance at making the playoffs (score one for the “cooked” conclusion).
That’s right - the chart also shows playoff odds. This is which is where don’t go 0-2 came from. In the 14-team era, an 0-2 team was expected to make the playoffs 13% of the time.8 A 2-0 team makes it 75% of the time. In just two games out of seventeen, and boom, the gap between “probably” and “probably not” becomes pretty wide. Another interesting artifact of this analysis is that an 0-2 team’s odds are the same as a 1-3 team’s, which is a fun way of saying that going 1-1 over the next two games doesn’t really help an 0-2 team at all. 0-3 is 6%. 0-4 is 2%, and that 2% is mostly the model being kind - in reality it’s an observed zero.
The table is a table of averages, and averages are exactly the thing I tend to warn about in these kinds of posts. So here is the same data without the averaging.
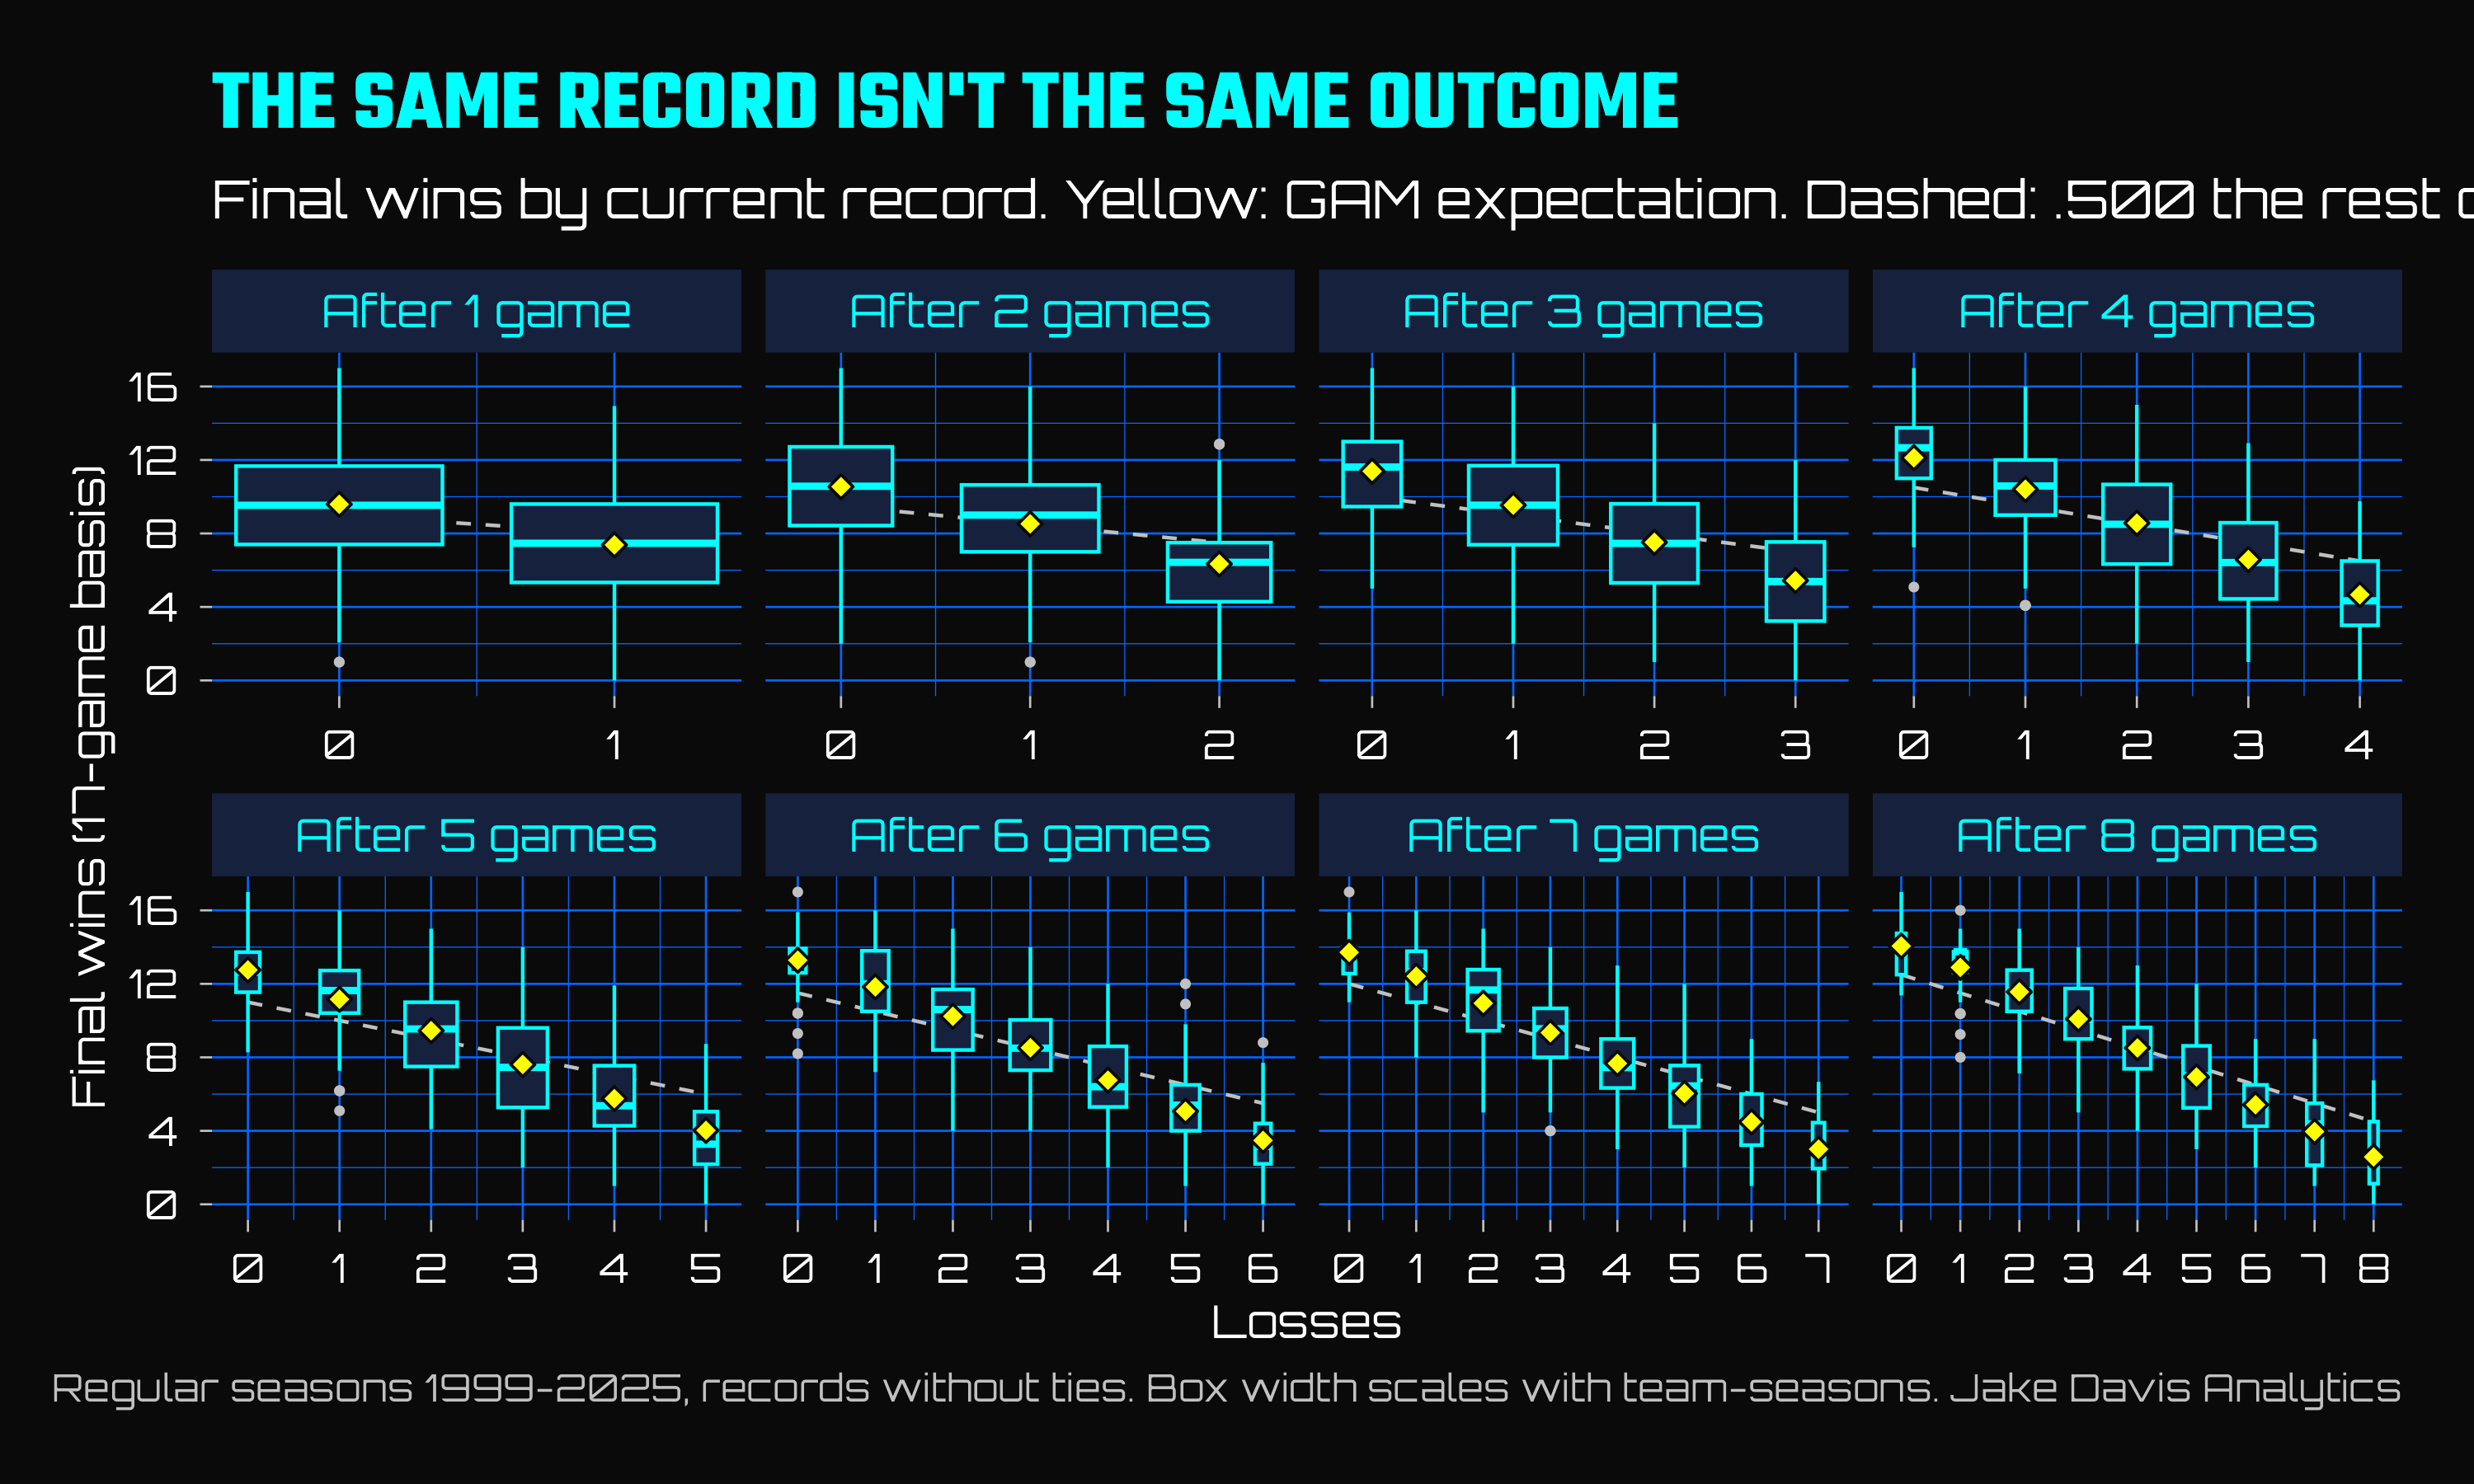
Each box shows every team that has ever held that record in a season, and the distribution of where they finished the year. The yellow diamond shows the model’s expected win total based on the record, and the dashed line is the coin flip view.
Two things stand out - the first is that the boxes step down as the losses go up. Every panel slopes down, and the diamonds sit above the dashed line on the left and below it on the right, more so with every week. The record is telling us something.
The second is that the boxes are tall, skinny fellas. The middle 80% of 3-1 teams finished between 7 and 14 wins.9 For 2-2 teams it’s 5 to 12. For 1-3 teams, 3 to 10. Even 0-4 teams range from 2 wins to about 8. Even with the early records information, you can still be wrong by three or four games about how the season ends, which is kinda the whole reason why I wrote that post a few months ago! Noisy information is still noisy!
So how much does an early record “carry-forward.” One way to find out - take a team’s current record and measure how far it is from .500. A 3-1 team is .250 above. Then measure how far the team’s results over the rest of the season land from .500. If the coin-flip view were right, the second number would generally average zero, no matter what the first number was. If the record-is-truth view were right, the two numbers would generally match. The share that carries over is somewhere between those two extreme views, and it can be estimated directly.10
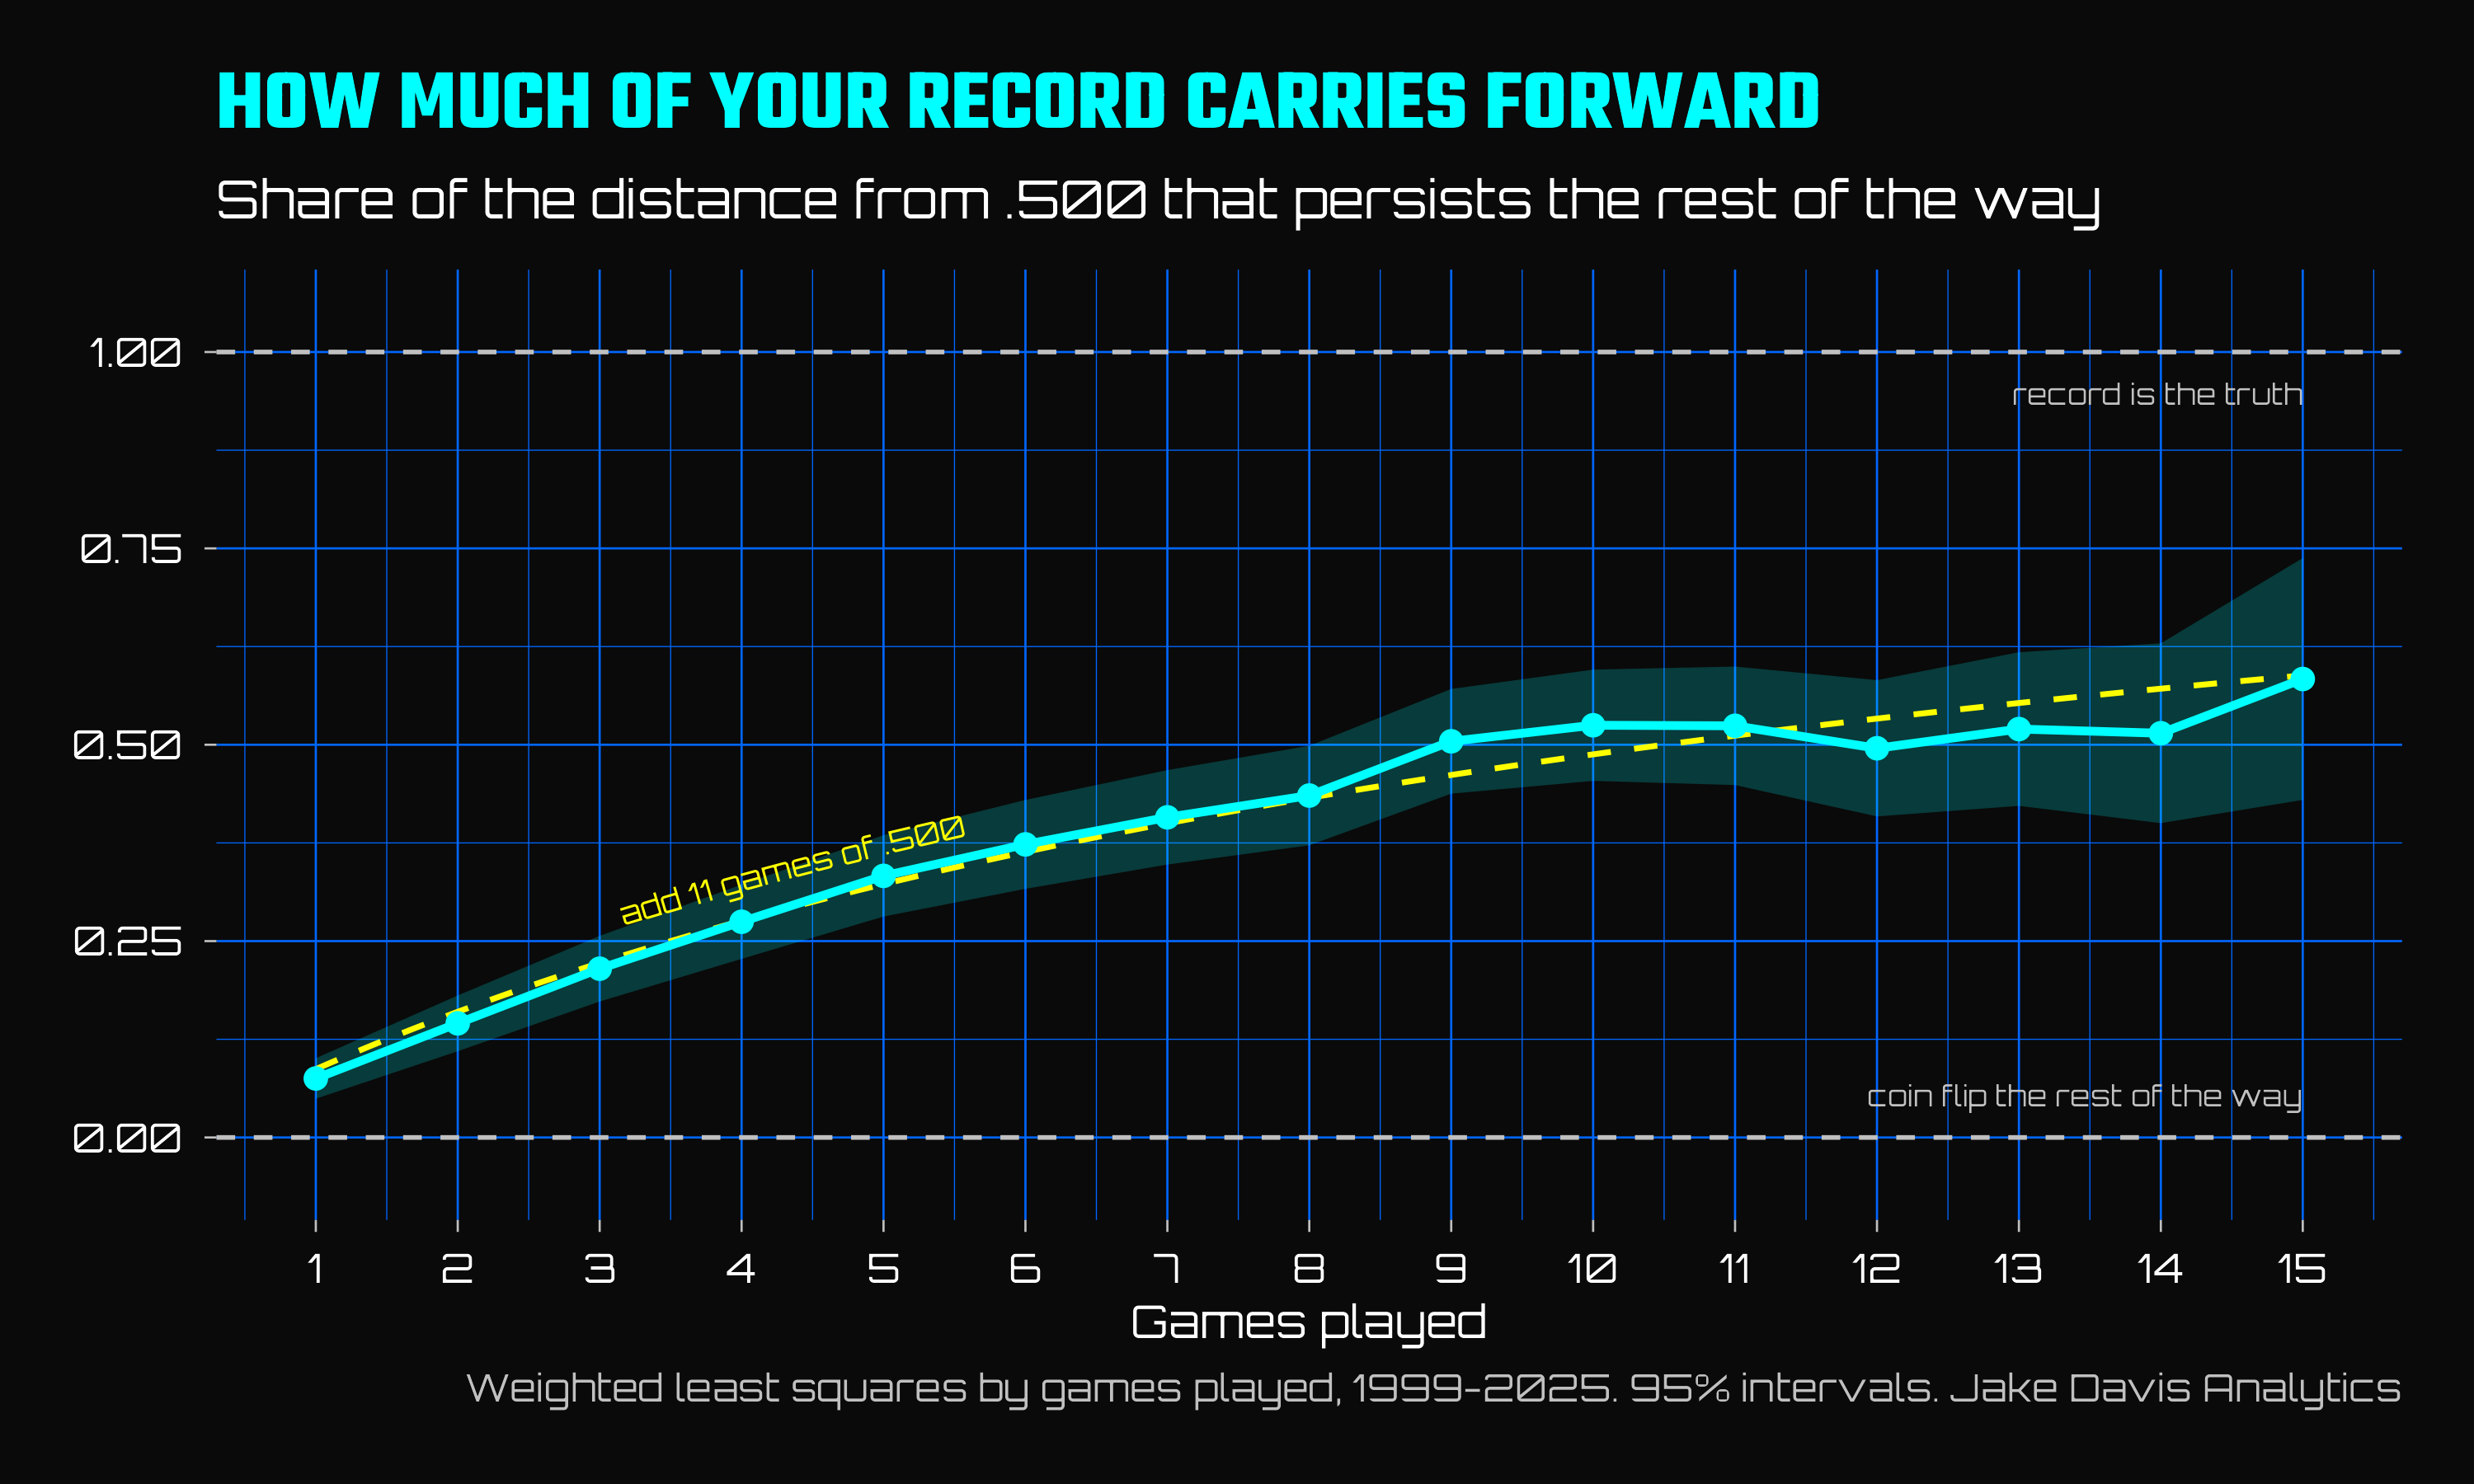
After one game, about 8% of a team’s distance from .500 carries forward. After four games, 27%. After eight, 44%. It takes until nine games, past the halfway point of the season, before the record is a coin flip between signal and noise: half of what you’ve seen in half a season is real and half of it disappears like a Steelers offense in the playoffs.
The yellow dashed line is the part I like. It isn’t fit point by point. It’s one formula with one parameter, and it tracks the observed curve almost exactly:
Persistence = games played / (games played + k), with k = 10.5
That formula has a practical reading. To guess what a team’s record is worth, add ten and a half games of .500 football to it.11 A 3-1 team becomes 3-1 plus 5¼-5¼, which is about 8¼-6¼, a .569 team. Play .569 over the 13 remaining games, add the three wins already on the books, and you get 10.4. That is the 3-1 cell in the grid.12 For a team that is 1-4, the same trick gives a .403 team, not the .200 team the standings say.
Statistically, this is how you can reconcile the “coin-flip” view, the “record-knows” view, and the “record doesn’t know you like it thinks it does” view . The record isn’t the truth and it isn’t nothing. It’s competing with ten and a half games’ worth of evidence that tells you nothing at all, and early in the season the nothing wins.
All of the above presupposes that a record is the only thing we know about a team. But we know more than that - we watch the games, we see the plays, and we know the scores. We know the how of teams got their records - by how many points, against whom, with what kind of preseason expectations.
That’s what LOWFI is for.13 And since it has been run backwards over every season since 2004, we can take this analysis beyond the record itself. Now we can ask - among all the teams that played four games and have the same record, does LOWFI know which ones were real?
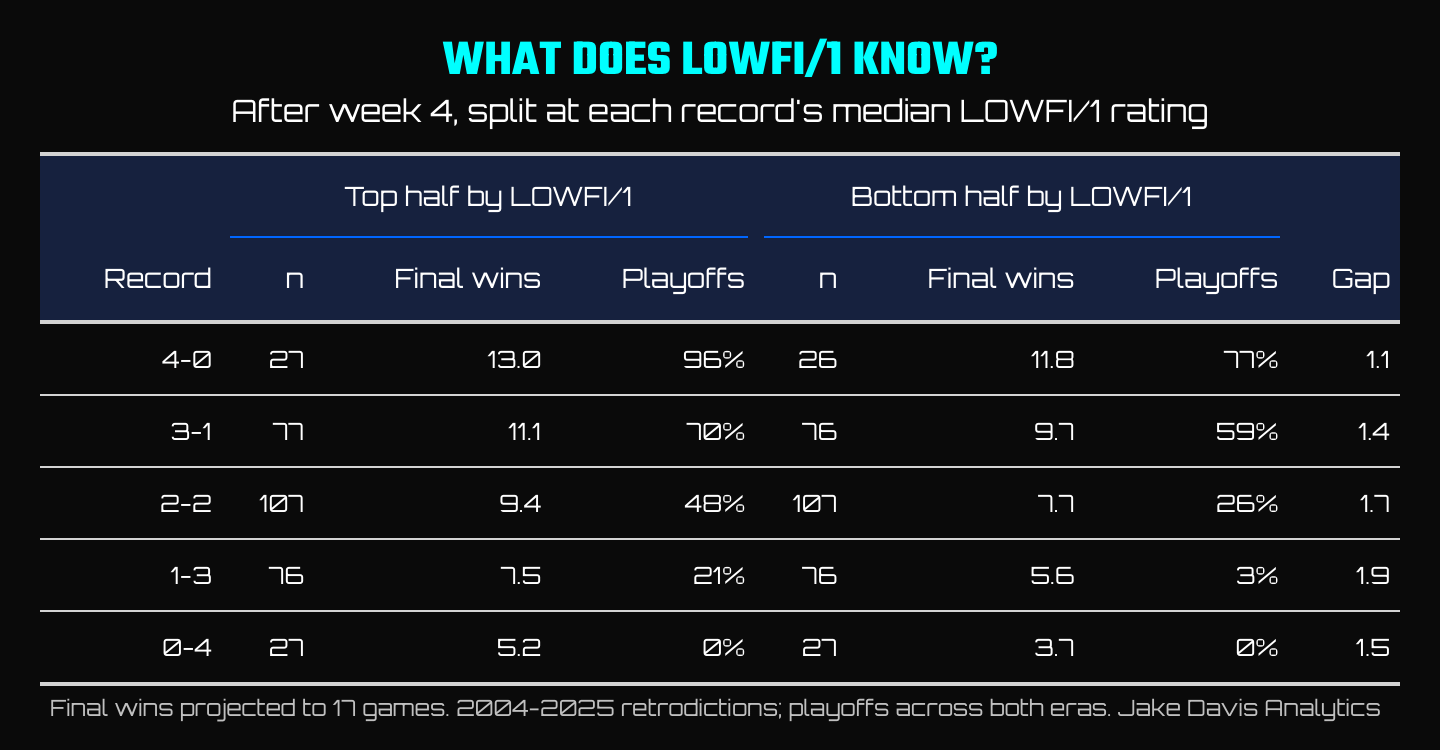
This table takes every team at a given record after four games and splits it in half by LOWFI/1’s rating. The top half of 3-1 teams finished with 11.1 wins and made the playoffs 70% of the time. The bottom half finished with 9.7 and made it 59% of the time. The same starting record, but pretty different teams.
The 2-2 split is the one LOWFI brought home from school and I hung on the refrigerator. The ones LOWFI liked finished with 9.4 wins and made the playoffs about half the time. The 2-2 teams it didn’t like finished with 7.7 and made it 26% of the time. That’s nearly a two-win gap between groups the early records say are identical. The 1-3 split is even wider: 21% to make the playoffs in the top half, 3% in the bottom. Even among 0-4 teams, the ones LOWFI rated better won a win and a half more the rest of the way, which matters to exactly one team this week. At every record, the split is worth between one and two wins.
Which leads to the obvious next question: once you know LOWFI, does the record still tell you anything useful?
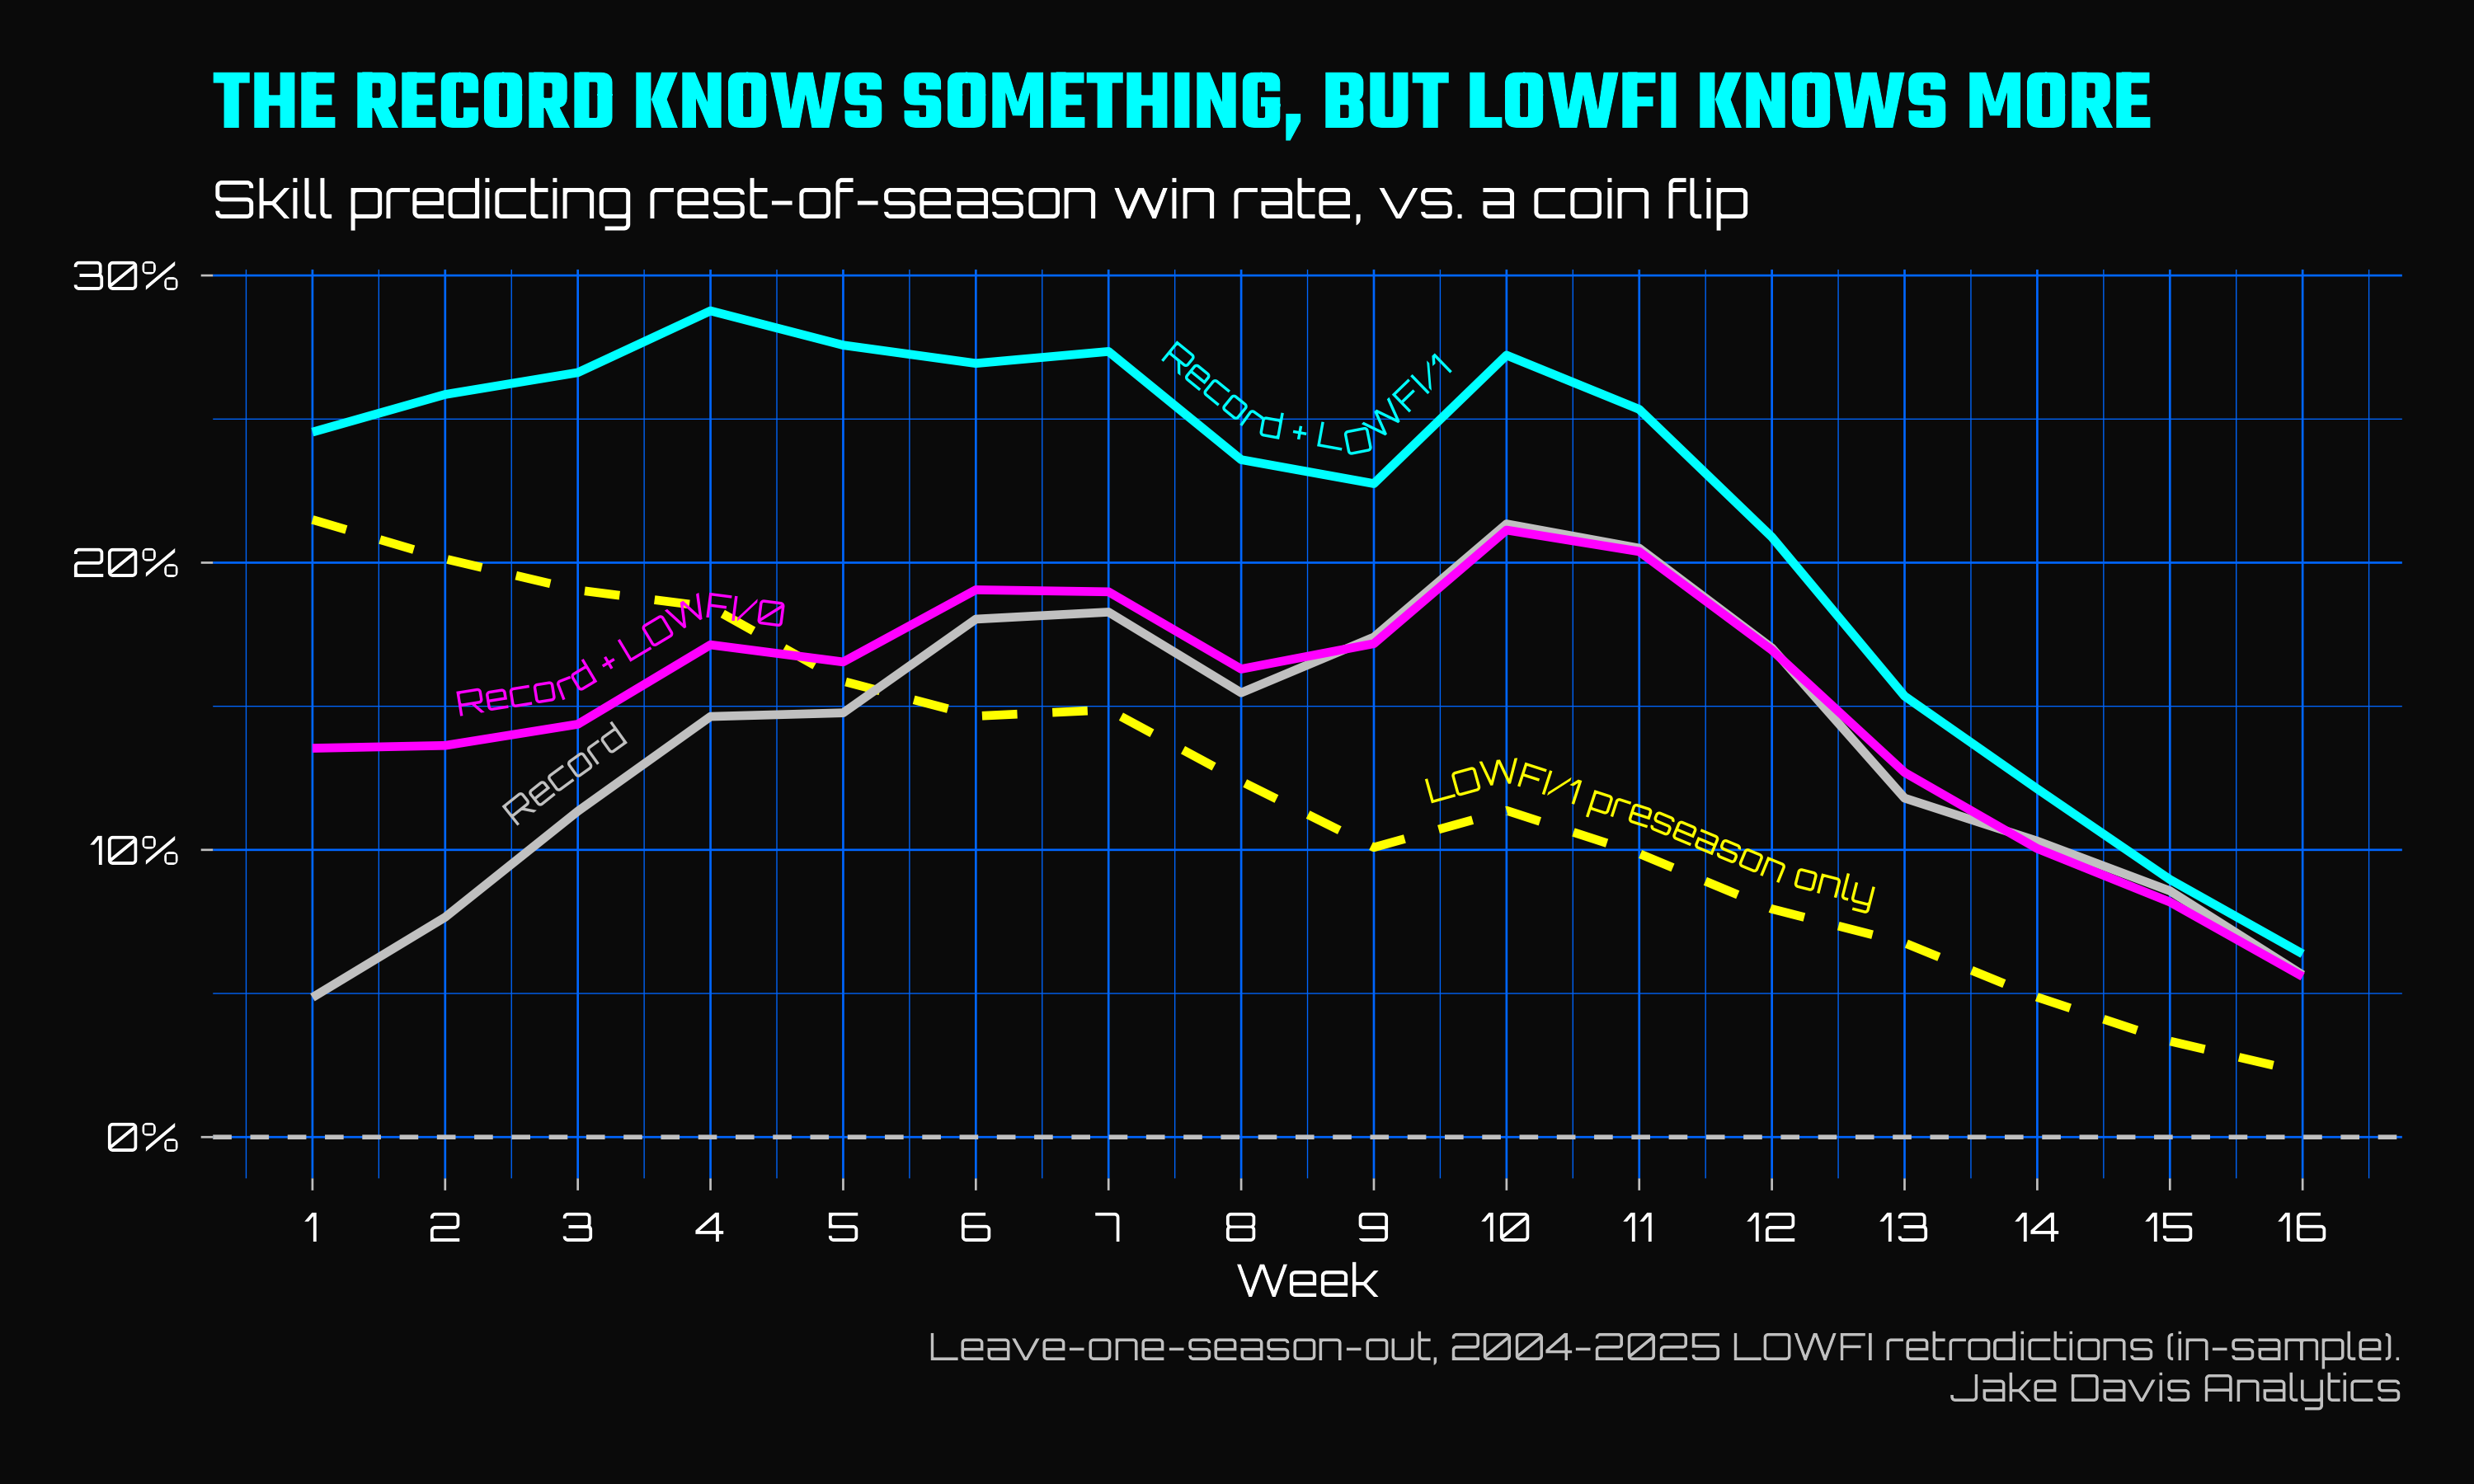
This chart shows how well each approach predicts a team’s win rate over the rest of the season, based on how much better it does than flipping a coin across the rest of the games.14 The gray line is the record. It starts at 5% in week 1), jumps to 15% by week 4, and peaks around 21% at midseason before fading as the remaining season gets too short to say much about anything.15
The cyan line is the record plus LOWFI/1. It starts all the way at 25% in week 1, five times the record, and is still about double it at week 4. And interestingly, LOWFI/1 by itself scores the same as LOWFI/1 plus the record. Once you know a team’s points-based rating, the record adds barely anything useful. The win-loss column is already baked into the points, just cooked into something way more informative.
The magenta line is LOWFI/0, which doesn’t know anything about how a team did it, it just has the same information as the record (plus a small preseason prior) with more statistical scaffolding. It starts way ahead of the record, because of that prior, and then merges into the record over the middle of the season. That’s the expected behavior, since LOWFI/0 is just a more disciplined and nuanced way of reading a record, so once the record has enough games behind it, the two should theoretically agree.
That leaves the obvious comparison problem, which is the yellow dashed line. LOWFI/1 starts each season from a preseason rating built largely from the betting market’s win totals.16 So how much of LOWFI’s gains are from LOWFI knowing something versus how much is from the market knowing something? The yellow line is LOWFI/1’s preseason rating alone - no games, no results, just what was expected of each team before kickoff.
It knows more than the record. Not just in week 1, where anything beats one game, but through week 5. Until a team has played five games, what people thought of it in August is a better guide to the rest of its season than what the team has actually done.
But the yellow line never catches the cyan one. LOWFI/1’s in-season updates are worth about 3 points of skill over its own preseason rating in week 1, 10 by week 4, and 12 by week 6. The market’s August opinion is a better starting point than the record. But scores are the best way to update it. The record is the least efficient way to read the games, regardless of what that local DJ is telling you on your way to work.
Back to Houston.
The record, as read straight off the modeled grid, says 0-4 is worth an expected 4.7 wins and a 2% chance at the playoffs. The box plot says the realistic range is 2 to 8 wins. Add the ten and a half games of .500 football and the Texans are a .362 team, not a winless one, which over thirteen games is still only four or five more wins. If you believe in the record, “cooked” is the right answer.
The good news for Texans fans is that record is the least informative thing you could know about the Texans. They came into the season with a preseason win total of 9.5, and as that yellow line suggests - at least through week 5 - the preseason opinion is a better guide than the current standings. They’ve been outscored by just 25 points across four games, which is the profile of a mediocre team that lost close games versus a terrible team. LOWFI/1 agrees so far - its rating for the Texans is better than 98% of the 0-4 teams in the database at the same point in the season. It views them as about a point per game below an average team, where the average 0-4 team in the database is roughly four points below an average team.
That should buy them something, if not a whole lot. LOWFI projects 6.2 wins and gives them a 9% chance at the playoffs. That’s not high - but it’s still four times what the record alone suggests! Hope floats, y’all.
So what’s the verdict? Not good. Not cooked, sure, but not good. And if anyone is going to be the first 0-4 team in a generation to sneak in, it may as well be the franchise that has already done the 0-3 dance twice.
My old tweet ended with don’t go 0-2, and I stand by that advice, trite as it is. I can make it a little more precise now. The record matters, it matters a bit more every week, and at no point in the season is it worth as much as it looks. If you want to know what your team’s record is worth, add ten and a half games of mediocrity to it. If you want to know what your team is worth, look at the points. Or better yet, at lowfi.jakedavisanalytics.com :)
-Jake
Schedules and results from nflverse via nflreadr.
LOWFI history from the LOWFI data release.
Yeah, I’m not gonna link back to that hellscape.
We miss ye, sometimes.
It isn’t
The 1992 Chargers famously started 0-4 and made the playoffs, but that was before the sample. Since 1999 it’s 0 for 81 from 0-4 and 2 for 129 from 0-3. I checked twice that the two 0-3 teams weren’t a data error. They aren’t. The Texans are just weird.
Oh fake you, how you always creep into my thoughts and writing. But either way, thanks for reading!
Regular season only. 1999-2025 covers 27 seasons and 861 team-seasons, which works out to about 15,000 week-by-week records. The 2022 version stopped at 2021 and treated every season as 16 games; this one runs through 2025 and reports everything on a 17-game basis. Ties count as half a win and half a loss, because ties suck.
Rather than averaging final wins directly, I model the win rate over the rest of the season, which doesn’t care whether a season had 16 or 17 games, and then project it onto 17 games: final wins = current wins + remaining games × rest-of-season win rate. The model is a quasibinomial GAM with a tensor-product smooth on wins and losses, weighted by games remaining. Where the raw averages are well supported, the model and the raw data agree to within about a tenth of a win. Yet another :thumbs-up: for using statistical models!
The playoff field went from 12 teams to 14 in 2020. The playoff model is a binomial GAM on wins and losses with a separate, lower-flexibility smooth for the 14-team era, so the two extra spots go mostly to bubble teams rather than being spread evenly across every record. A simpler version shifted every team’s odds by the same amount and put a 0-0 team at 48% to make the playoffs. Fourteen of thirty-two is 44% (this means that my first try was wrong! Hence the additional smooth, don’t tell Dan Taylor I admit this). Models should be able to count, just like people. This one now can: at every point in the season, its average playoff probability across 14-team-era teams lands within a percentage point of 44%.
That’s the 10th to 90th percentile, with 221 teams in the 3-1 box, 280 behind 2-2, 194 behind 1-3 and 81 behind 0-4. 16-game seasons are put on a 17-game basis the same way as in footnote 7.
For each number of games played, a weighted regression of (rest-of-season win% − .5) on (current win% − .5) with no intercept, weighted by games remaining. The slope is the share that carries forward. After 16 games only the 17-game seasons have anything left to predict, so the chart stops at 15. If you read the August post, the slope here is the equivalent of the shrinkage factor from the Beta-Binomial, measured instead of assumed.
Under a Beta-Binomial, the share of the record that carries forward is g / (g + k), where k = α + β is the prior’s strength in games. Fitting that curve to the fifteen estimates gives k = 10.5, with a 95% interval of 9.9 to 11.1. Adding k games at .500 is basically the same calculation. Baseball people (those sabermetric punks) will recognize this as the old trick of regressing a record by adding a fixed number of .500 games, and they will probably be insufferable about knowing it for decades.
It also implies a standard deviation of true win percentage of √(.25 / 10.5) = .154, or about 2.6 wins over 17 games. That’s the true-talent spread, with the luck taken out, and it’s within reasonable distance of the .147 that LOWFI/0 uses for the same quantity. It is not the .186 spread from the records post, which measured the spread of observed records, luck included. It’s the same thing measured two different ways - neither might be right, but neither one is wrong. Statistics is fun.
Skill is 1 − (squared error / squared error of a coin flip), on rest-of-season win rate, weighted by games remaining. Each week, each approach is a small quasibinomial regression, scored leave-one-season-out: fit on every season but one, predict that one, repeat. That keeps the regressions clean. Each approach uses the rating as an input to the regression, not LOWFI’s own projections.
Late in the season the thing being predicted is a win rate over three or four games, which is noise no matter how much you know. Even knowing every team’s true strength, with one game left you couldn’t score above about 9%. I’ll say it again: small samples, man.
De-vigged preseason win totals, modeled into offense and defense using the prior season’s ratings. Deets are in the LOWFI/1 methodology post.