


As we cross the mid-point in the 2026 season, it’s a good as time as any to take a glance at where things stand across the NFL, at least according to LOWFI.1
THE TOP AND THE BOTTOM
LOWFI/1’s top and bottom teams going into week 10 are pretty far from what the preseason rankings expected - here are the top/bottom 5 by net rating.2
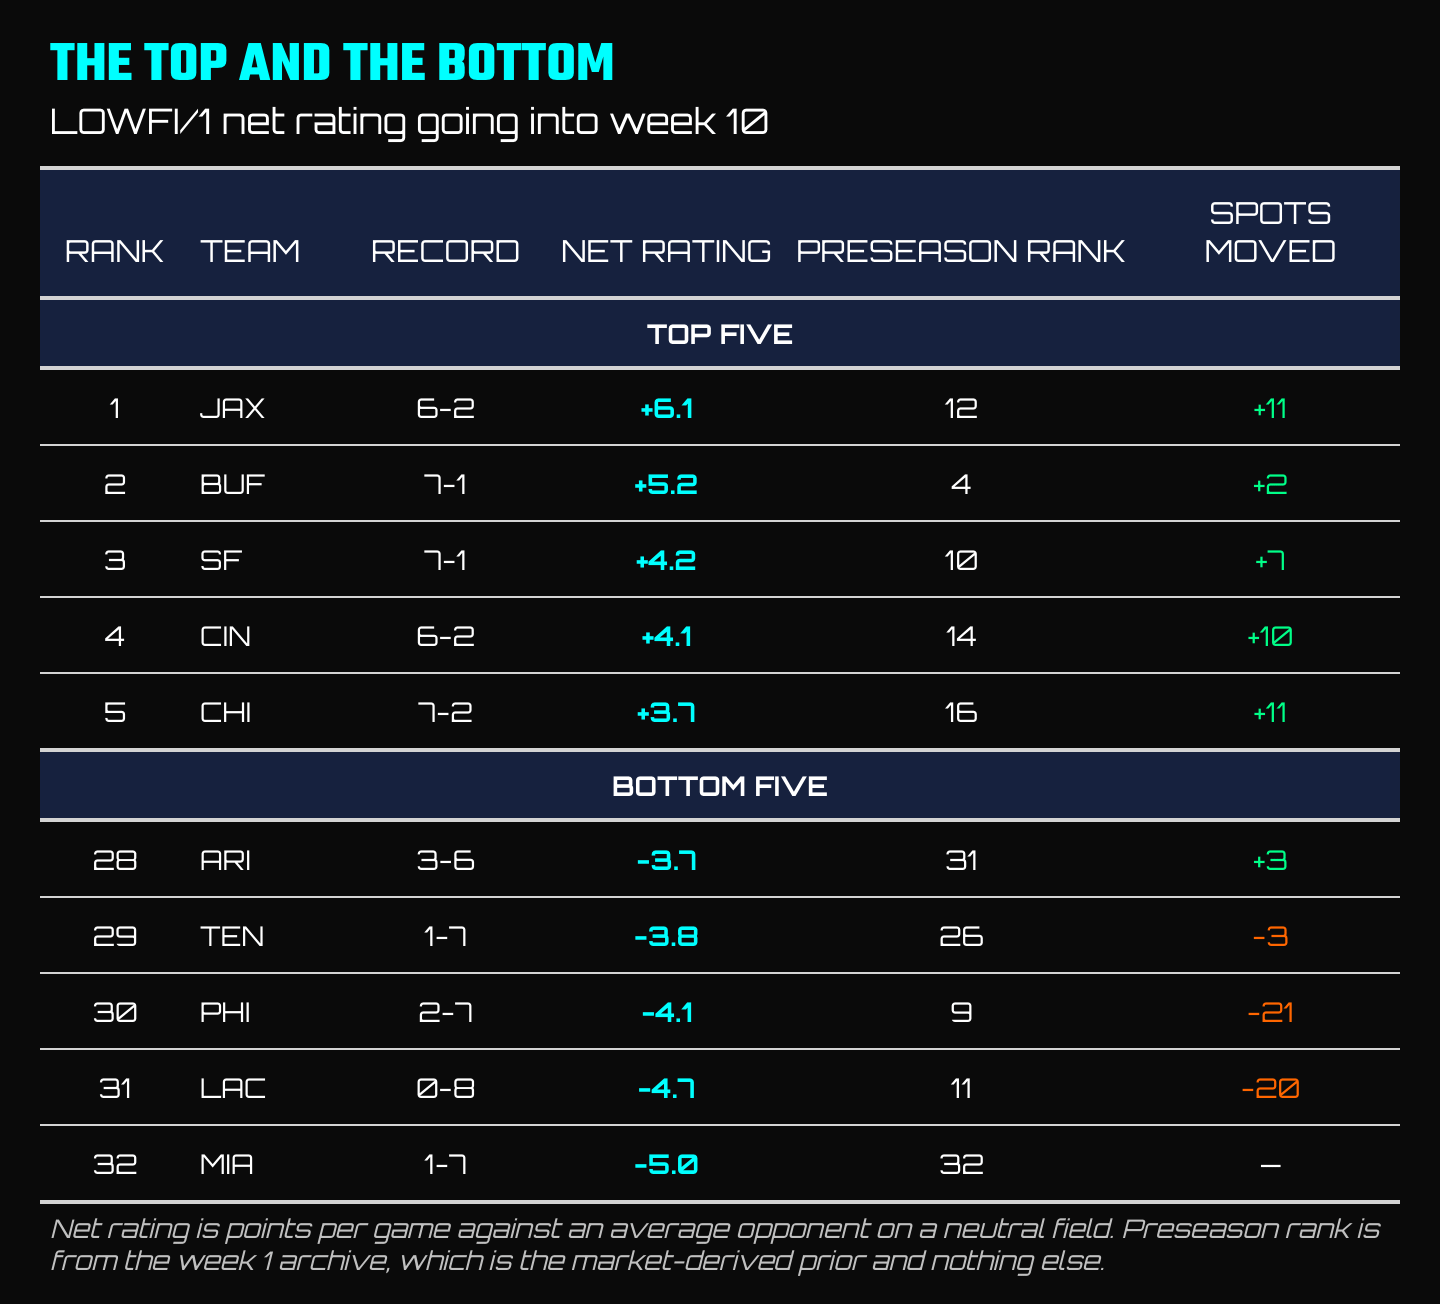
Since the preseason ranks are so tightly correlated with Vegas, you can think of movement from the preseason as LOWFI/1’s season estimates disagreeing with Vegas, rather than LOWFI having found something Vegas missed. Whether LOWFI has learned anything since is a separate question - I’ll explore that more below.
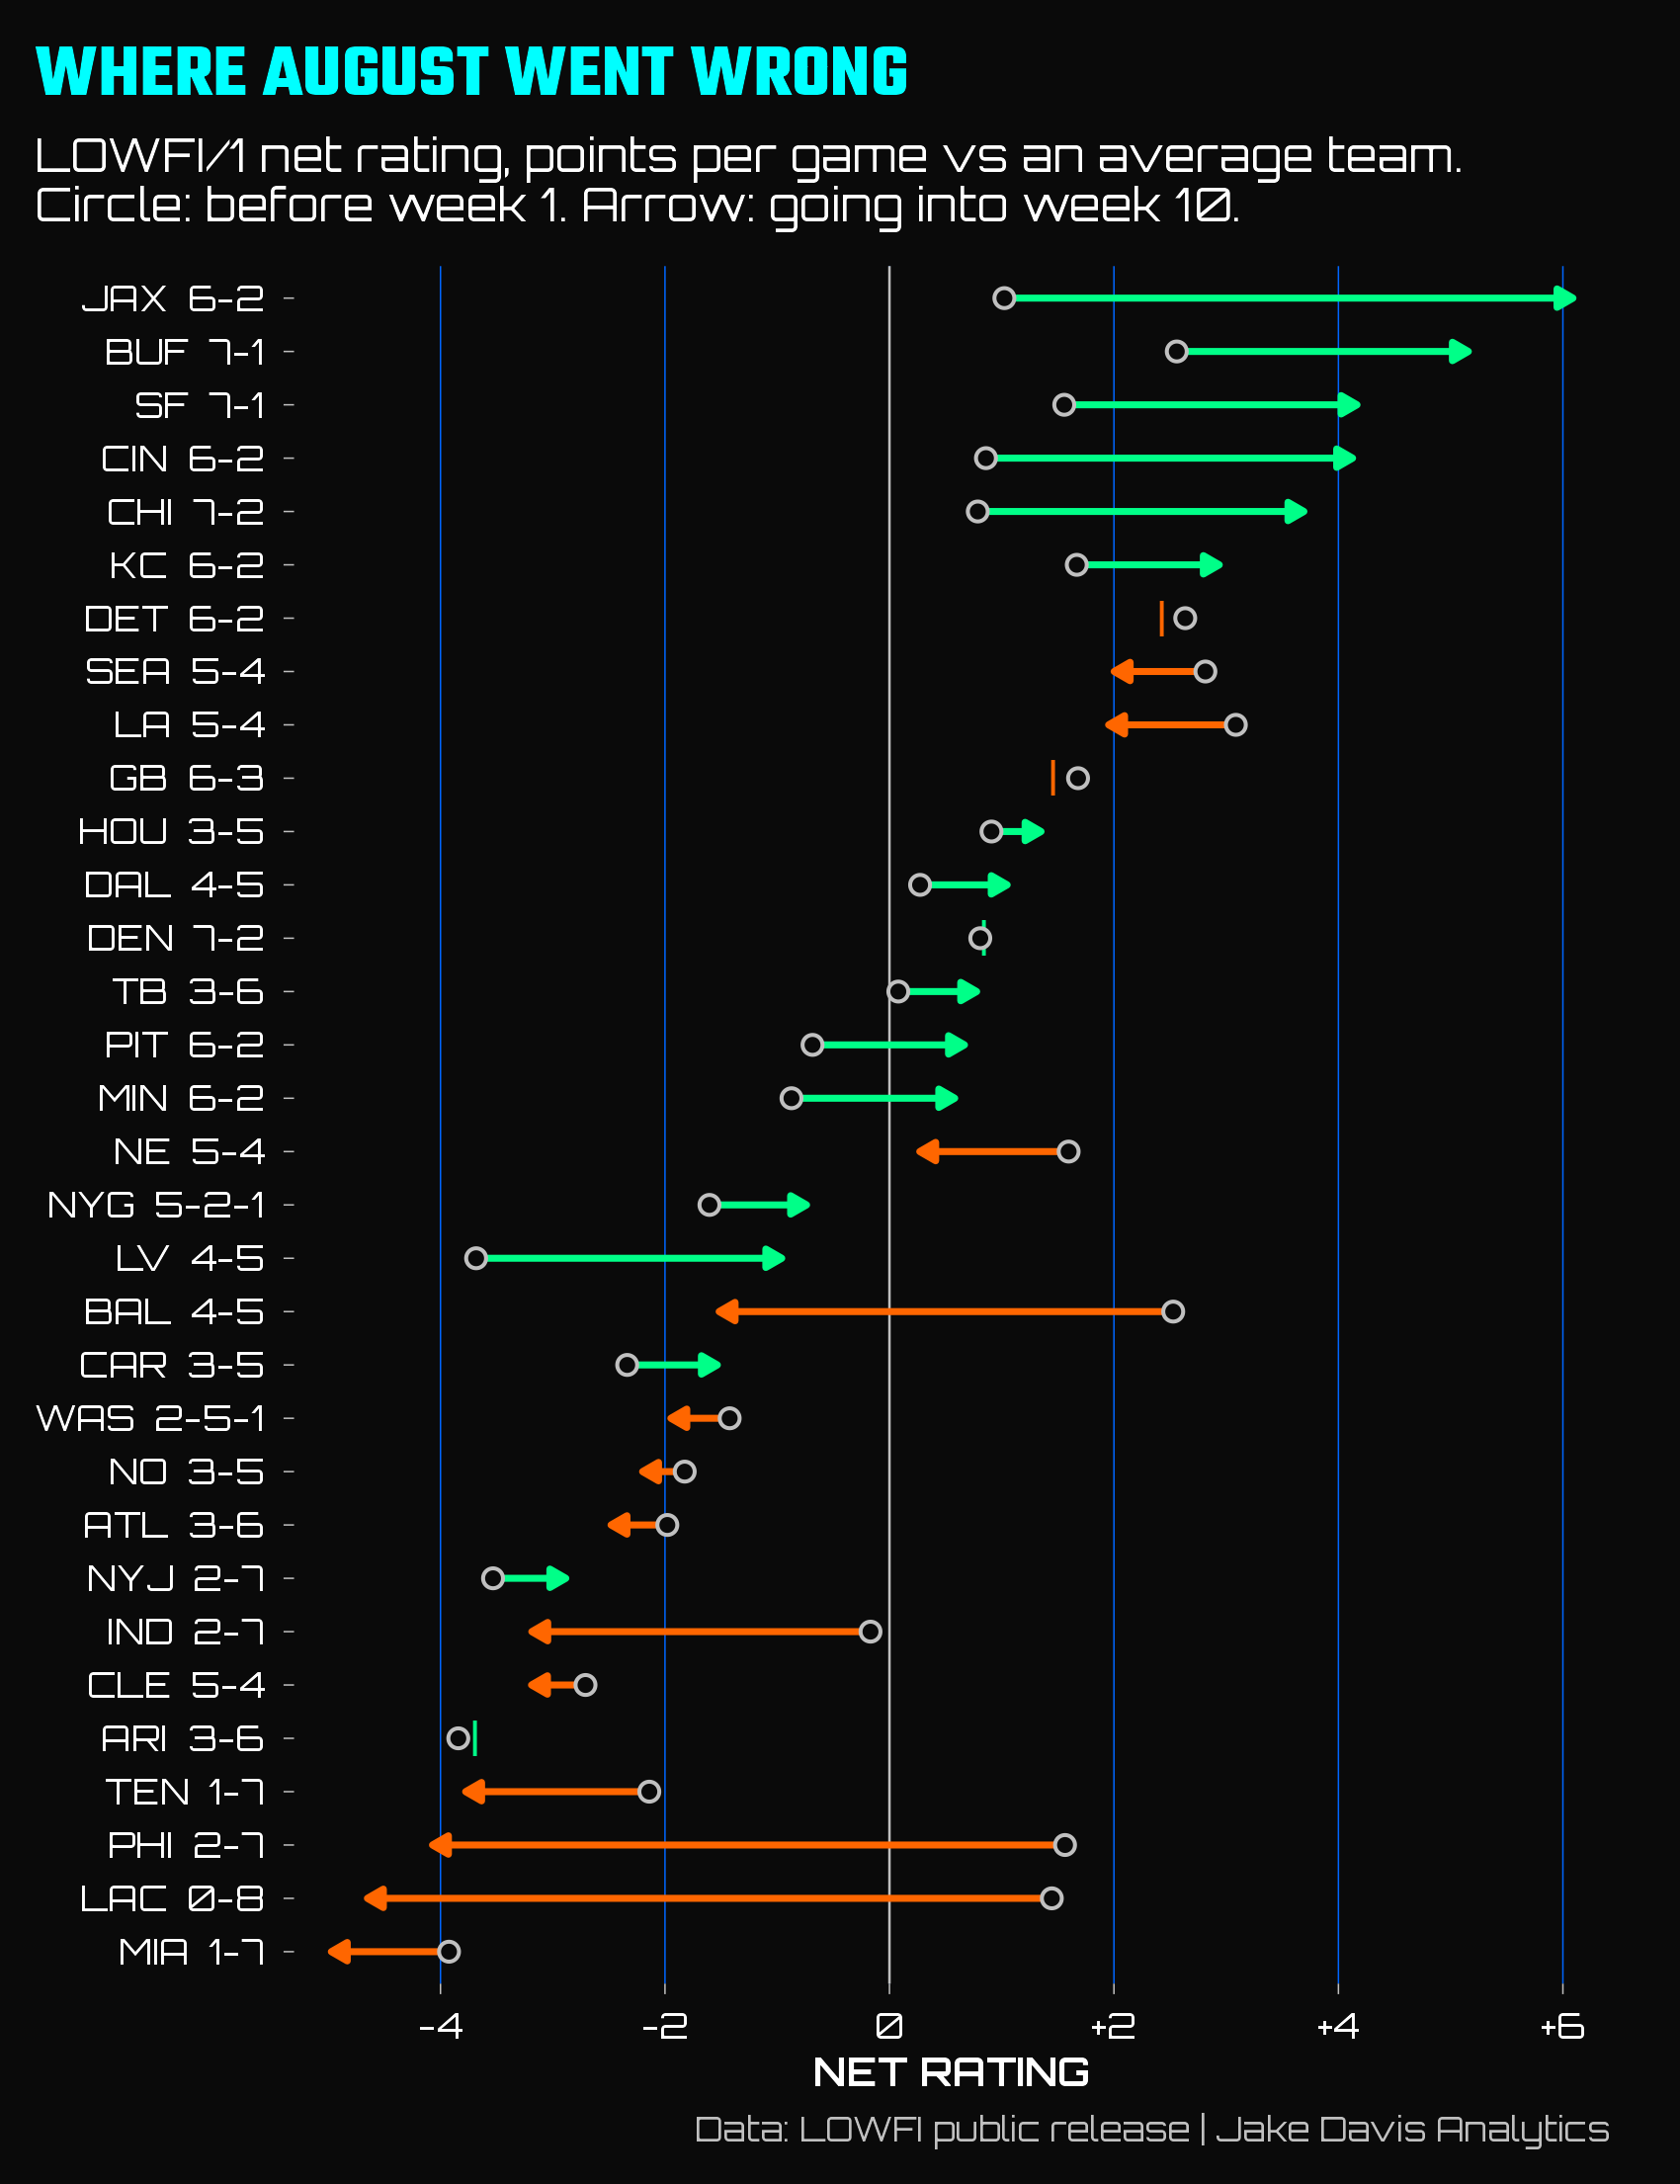
Only Buffalo has kept it’s top-5 designation, climbing from 4th to 2nd. The Rams and Seahawks opened first and second - both are now 5-4, ninth and eighth, respectively, and sitting behind the 7-1 San Francisco 49ers in their own division. Detroit’s rating has barely moved, but it’s ranking slid from third to seventh, while Baltimore has collapsed to 20th (and will probably fall further, even though LOWFI has no idea that Lamar Jackson is on IR).
Through the first half of the season, Jacksonville is the biggest story. The Jaguars are up 5.1 points per game since August, the biggest move in the league, and their net rating is driven by success on both sides of the ball (+3.2 on offense, +2.9 on defense). LOWFI/1 initially gave them a 4% chance to win the Super Bowl - now they sit as current favorite with a 21% chance, ahead of Buffalo (18%), San Francisco (13%), and Cincinnati (10%).
The bottom 5 is weirder. Miami was last in the preseason ranks and is last now, so at least that makes sense. The Chargers and Eagles, though - they were supposed to be playoff teams! LAC and Philly had 54% and 59% chances at the playoffs before week 1, and effectively zero today, with the Chargers down 6.1 points per game and the Eagles down 5.6. Baltimore opened at 66% to make the playoffs, second best in the league, and is down to 11%. Indianapolis went from 43% to under 1%.
WHAT LOWFI HAS LEARNED
If the preseason rating is mostly borrowed from Vegas with a sprinkle of prior season regression thrown in, the naturally more interesting part of LOWFI is how it updates itself: nine weeks of box scores turning a market prior into its own opinion.
So what has LOWFI learned? Here is a way to test it - take all the games from weeks 2 through 9 and predict each final margin based on three ideas: with LOWFI’s preseason ratings frozen in place, with LOWFI’s ratings going into that game, and with the market’s line.
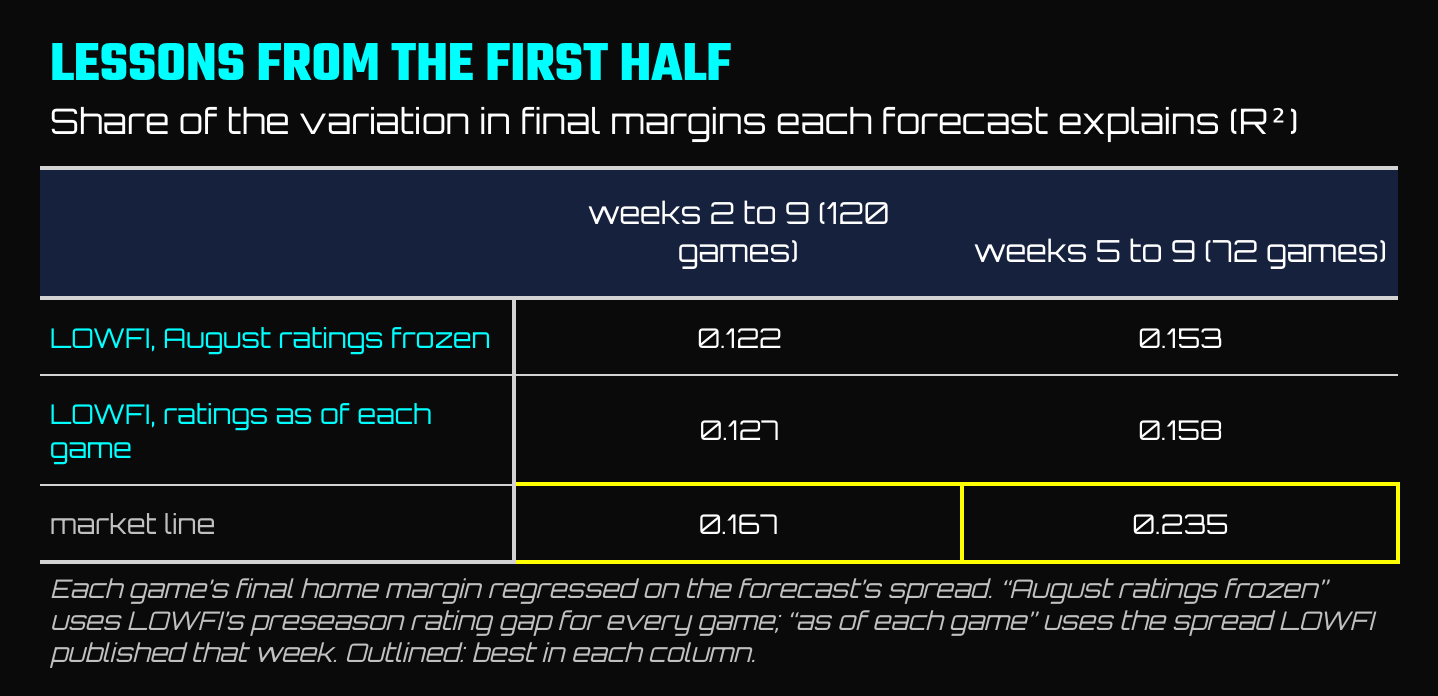
Well, that’s not great! Nine weeks of updating have improved LOWFI’s game-by-game forecasts by…almost nothing. Over the same stretch, the market’s lines have gotten much better.
What’s interesting is that LOWFI/1’s rating changes line up with the market’s (a 0.72 correlation, game by game). The problem is how much the ratings have moved. When I split each LOWFI forecast into the preseason component and what it has learned since then, and then ask how much actual margin each point of either one has been worth,3 I find that a point of preseason is worth 1.24 points of margin, while a point of update is worth 0.55. The market’s updates are worth 0.83 a point.
In simpler terms: LOWFI is moving the right direction, about twice as far as the evidence actually supports. Roughly half of every point it has moved since August is noise. That isn’t necessarily surprising, given how LOWFI is built.4 LOWFI mostly reads and manipulates the final scores and nothing much else, so a win padded by two garbage-time touchdowns counts the same as a genuine butt-whooping. And it knows nothing about injuries, unlike the market.
The model over-reach was most evident early. Through week 3, LOWFI rated Chicago 4.1 points per game better than the market and the Eagles 3.7 worse, and both calls look great now…but it also rated Minnesota 2.3 worse and Indianapolis 2.0 better, and both look truly terrible. By weeks 8 through 10 the market had caught up on Chicago (the gap is down to 0.1) and gone past LOWFI on Philadelphia: LOWFI is now 3.1 points higher on the Eagles than the market suggests. Over the same stretch, LOWFI’s side of the spread went from 30-32 in weeks 1 to 4 to 26-44 since.
RECORDS THAT DISAGREE WITH THEIR RATINGS
A few teams have records LOWFI doesn’t quite believe.
Denver is 7-2 and rated 13th (+0.9). They’ve outscored opponents by 1.3 points per game, which is a .540 team by the Pythagorean formula and about 2.2 wins beneath their record. It doesn’t really matter - a banked win is a banked win, and LOWFI/1 now gives them 92% to make the playoffs.
Cleveland is 5-4 and rated 27th (-3.2), with a 1.5-win gap between record and points. This is the biggest disagreement between how LOWFI/0 sees a team vs LOWFI/1. LOWFI/0, which only sees who won, gives the Browns 45% to make the playoffs. LOWFI/1 gives them 25%5
Minnesota is 6-2 with the 28th-ranked offense6 (-2.9) and the best defense in football (+3.5). The Giants are 5-2-1 with a negative rating.
On the flip side, Tampa Bay is 3-6 and has outscored opponents by 2.7 points per game, 2.2 wins below where the points say it should be. It’s also the best team in the NFC South by a comfortable margin, so LOWFI still gives the Bucs a coin flip (49%) to win the division.
And since I wrote about it elsewhere: at 0-4, I called Houston “not cooked, sure, but not good,” with 6.2 projected wins and a 9% chance at the playoffs. The Texans have gone 3-1 since then. They’re now rated 11th, projected to get to 8.1 wins, and sit at 26%. Not cooked looks right, but not good may have been a not good claim.
THE SCOREBOARD
I’ve said it in posts, I say it on the interactive, and I’ll say it again - the LOWFI system wasn’t built to beat the market, and through nine weeks it isn’t. Scored on the home win probability with the usual rule, 25 − 100 × (P − R)²:
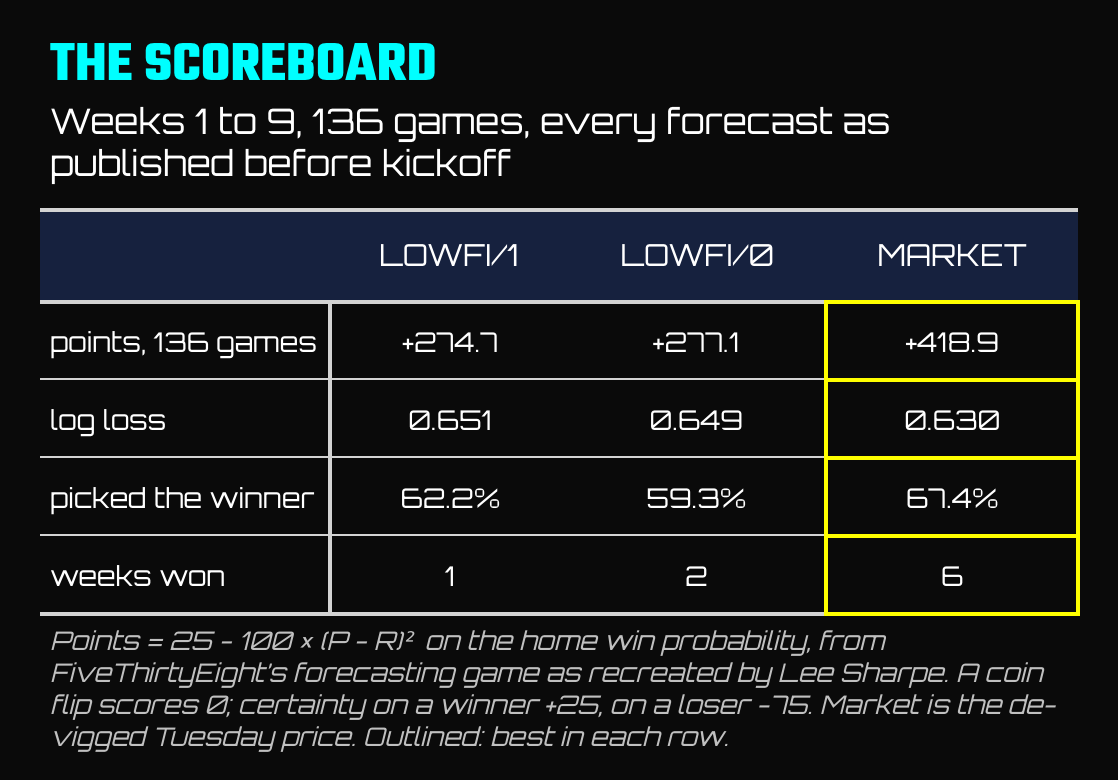
The market’s lead was only 19 points after week 5, but weeks 6 through 9 added another 125. All models are having a slightly harder year than usual - based on held-out seasons, we should expect log loss around 0.632 for LOWFI/1, 0.642 for LOWFI/0, and 0.610 for the market. One thing that has been consistent is the relative quality of the models - LOWFI/1’s gap to the market is about 0.02, roughly what the backtest suggested.
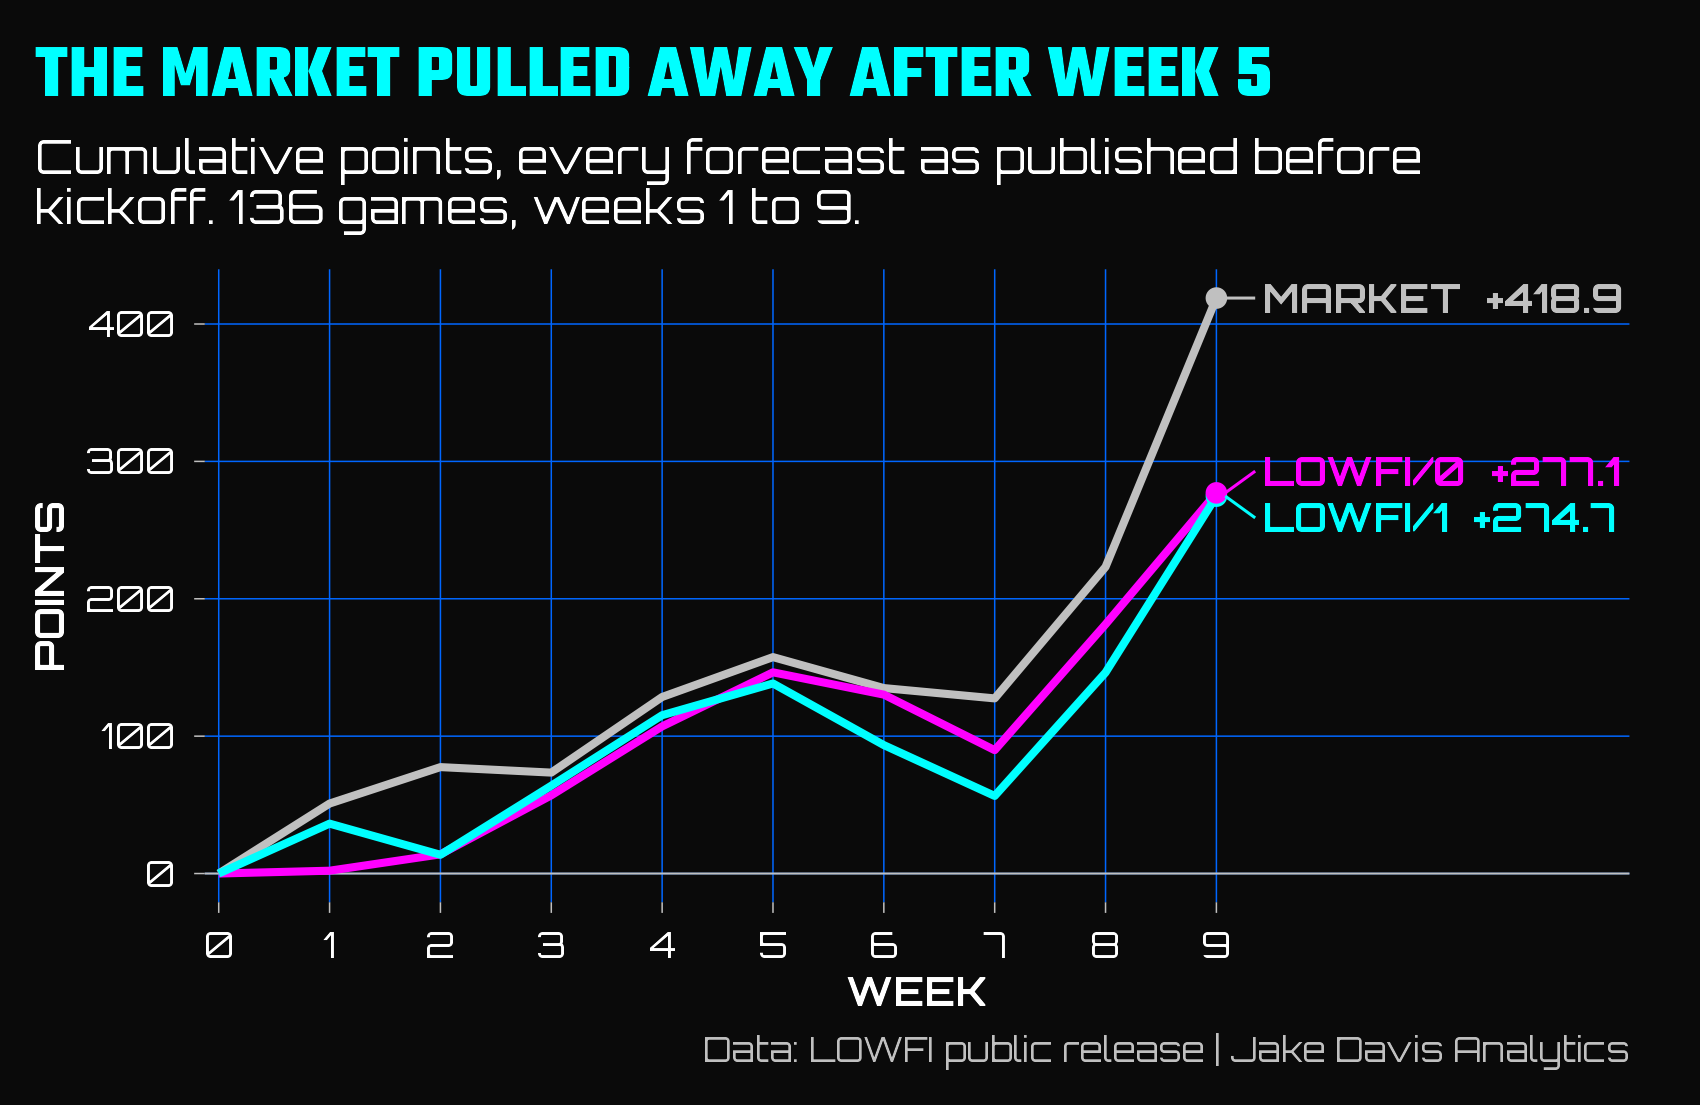
When I wrote the introduction to the LOWFI system, I said I was curious as to whether the gap between LOWFI/0 and LOWFI/1 would hold. So far there hasn’t been much of one. The model that knows the scores and the model that only knows who won are separated by just 2.4 points across 136 games, in LOWFI/0’s favor.
BEST AND WORST BETS
One positive7 of writing this post is that I had to dig into the data from an analytic perspective versus purely a modeling one, so of course I found a bug in the code. All season long, the interactive’s COVER, PUSH, and spread STAKE columns have been wrong. The cover probability had a sign flipped on the spread, so it priced the wrong side of the line, and most of the spread stakes went to whoever was favored at home.8. LOWFI’s line, both models’ win probabilities, the moneyline stakes, and the scoreboard were never affected. It’s fixed now, and every week on the site and in the data release has been corrected. The data release logs it in CORRECTIONS.md, as the first (and hopefully last) entry.
With that fixed, here’s the real spread record - 84 stakes, 38-43-3, down 18.0 units on 153.4 staked (−11.8%). The bigger disagreements caused the most problems: when LOWFI and the line were more than three points apart, LOWFI won 13 of 30 stakes for −10.5 units. Week 4 was the best week (+12.4), week 9 the worst (−16.0).
On the moneyline: 97 stakes, 32-64-1, down 12.3 units on 158.9 staked (−7.7%). That number hides a fun shape. Through week 8, LOWFI was up 8.4 units. Then week 9 went 0-12 for −20.7. Favorites won everywhere, which is also why week 9 was LOWFI/1’s best scoreboard week of the year (+128.4) and still lost to the market by 67 points.
All in, spreads and moneylines together: down 30.3 units on 312.3 staked (−9.7%). I said before that I wouldn’t use it to place bets, and now you know why.
The best moneyline stakes so far, all underdogs:
Arizona +600 at the Rams, week 6. Won by two. +12.0 units.
Giants +390 at Houston, week 7. +7.8 units.
Tampa Bay +350 at Dallas, week 5. +7.0 units.
Arizona +410 at the Chargers, week 1. +6.7 units.
The best single call wasn’t a long shot. In week 3 LOWFI/1 gave Chicago a 69% chance against Philadelphia while the market had the Bears at 38%. Chicago won by 20, and that one game was worth 28.6 scoreboard points of separation from the market.
The worst: Tampa Bay +164 at home against Green Bay in week 4, one of the biggest disagreement of the early season (LOWFI made the Bucs a 2.3-point favorite; the line had them as 4.5-point underdogs). Packers by three. Tennessee +250 against Houston in week 5, lost by 23. Baltimore +370 at home to Jacksonville in week 9, also lost by 23, though in LOWFI’s defense, it had no idea that Baltimore was starting Joe Fagnano, a guy I’ve definitely heard of before that game.
LOWFI is an intentionally constrained system - it’s got some flaws, but I’m still pleased with its overall performance given its limitations. Hopefully the back half of the season will show improvement, both for LOWFI and Justin Herbert’s career prospects. Until then, don’t believe in the Steelers - LOWFI hasn’t bought the record, and that’s maybe its best attribute.
As always, ratings, projections, and the scoreboard update on the site every Tuesday, and everything in this post comes from the public data release through week 10.
-Jake
LOWFI is my constrained NFL projection system. It stands for Latent Outlook Weekly Forecasting Interval
Net rating is LOWFI/1’s best estimated points per game against an average opponent on a neutral field. The preseason ranks come from LOWFI/1’s preseason model, which is mostly informed by the preseason Vegas win-totals. See the methodology for more details
Least squares of final home margin on the August component (the preseason rating gap) and the update (the current gap minus the preseason one), weeks 2 to 9. LOWFI’s rating units are converted to points at its own exchange rate, 1.24 spread points per rating point. Standard errors are large, 0.35 on LOWFI’s update and 0.31 on the market’s, so a fully efficient update (1.0) is about 1.3 standard errors away. The market’s August line is its week 1 lines regressed on LOWFI’s preseason ratings, and its update is everything since. Weeks 5 to 9 alone show the same pattern: 1.52 for August and 0.69 for the update for LOWFI, against 1.40 and 1.05 for the market.
Here, once again, is where I stress the constrained aspect of LOWFI!
I swear that as a Steelers fan, I didn’t program the model to hate Cleveland - they did that themselves by being perennially terrible
LOWFI doesn’t know that Mr. You Like That is coming back to town!
Maybe?
For the curious - the code treated the posted spread as the home team’s handicap (negative when favored) when it’s actually stored as the expected home margin (positive when favored). A home team favored by 10.5 that LOWFI made an 8.9-point favorite showed a 94% chance to cover. The right answer was around 45%.